
Real-time monitoring of heavy precipitation
NOTE: We now also have a site showing similar maps for the entire US, using Atlas 14 where available and older NOAA atlases where updated information is not yet available.
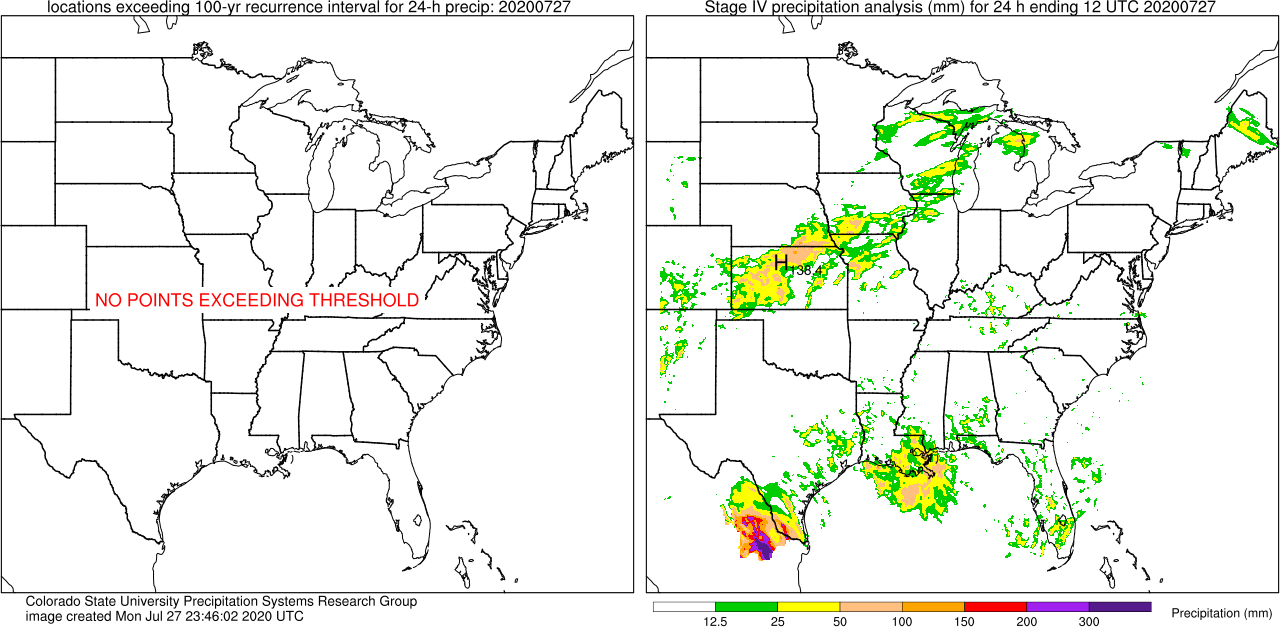
These images show locations where the 100-year recurrence interval for 24-h precipitation has been exceeded. This is an automated search for the types of events discussed in Schumacher and Johnson (2005, 2006), using gridded precipitation analyses, except that only higher-intensity events are identified. The current image is below, with a link to past days when the threshold has been exceeded. Images are created at around 1545 UTC each day, and then updated multiple times to incorporate updated data.
Switch to a different threshold:
Current image
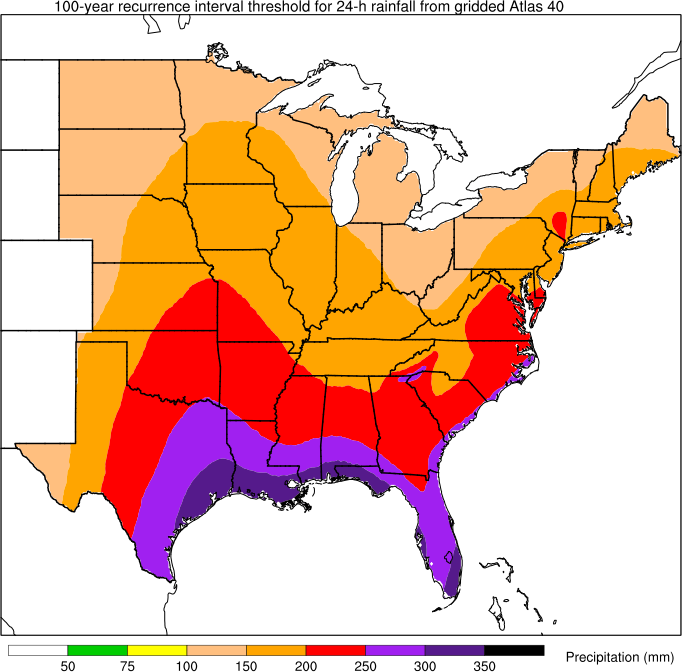
Click here to see the threshold
