Verification of CSU WRF and NCEP model forecasts: precipitation
See 21-day archive of stage IV precipitation analysis for Colorado domain or full domain 2.
 See 21-day archive of comparisons between the stage IV precipitation analysis and NCEP and CSU WRF forecasts for 12--36-h precip forecasts or 36--60-h precip forecasts.
Verification statistics from previous full months: Dec 2011 Jan 2012 Feb 2012 Mar 2012 Apr 2012 May 2012 Jun 2012 Jul 2012 Aug 2012 Sep 2012 Oct 2012 Nov 2012 Dec 2012 Jan 2013 Feb 2013 Mar 2013 Apr 2013 May 2013 Jun 2013 Jul 2013 Aug 2013 Sep 2013 Oct 2013 Nov 2013 Jan 2014 Feb 2014 Mar 2014 Apr 2014 May 2014 Jun 2014 Jul 2014 Aug 2014 Sep 2014 Oct 2014 Nov 2014 Dec 2014 Jan 2015 Feb 2015 Mar 2015 Apr 2015 May 2015 Jun 2015 Jul 2015 Aug 2015 Sep 2015 Oct 2015 Dec 2015 Jan 2016 Feb 2016 Mar 2016 Apr 2016 May 2016 Jun 2016 Jul 2016 Aug 2016 Sep 2016 Oct 2016 Nov 2016 Dec 2016 Jan 2017 Feb 2017 Mar 2017 Apr 2017 May 2017 Jun 2017 Jul 2017 Aug 2017 Sep 2017 Oct 2017 Nov 2017 Dec 2017 Jan 2018 Feb 2018 Mar 2018 Apr 2018 May 2018 Jun 2018 Jul 2018 Aug 2018 Sep 2018
NOTES:
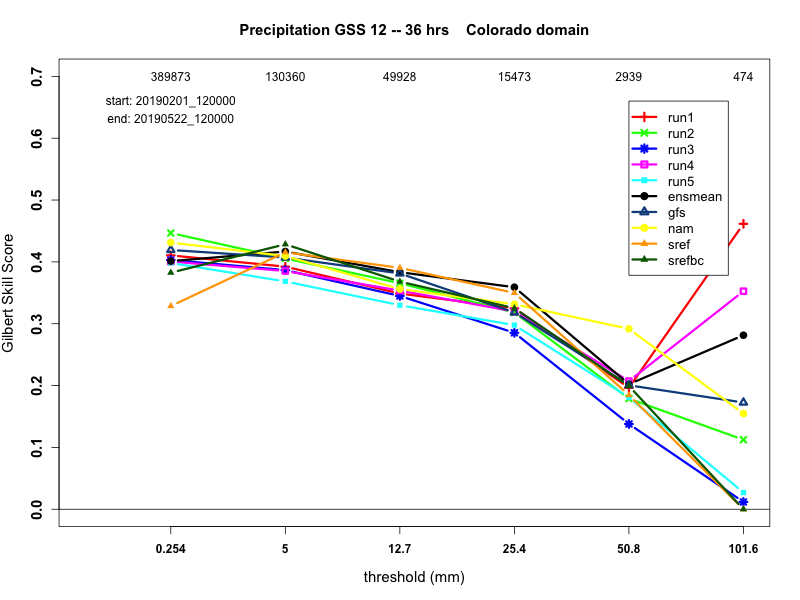
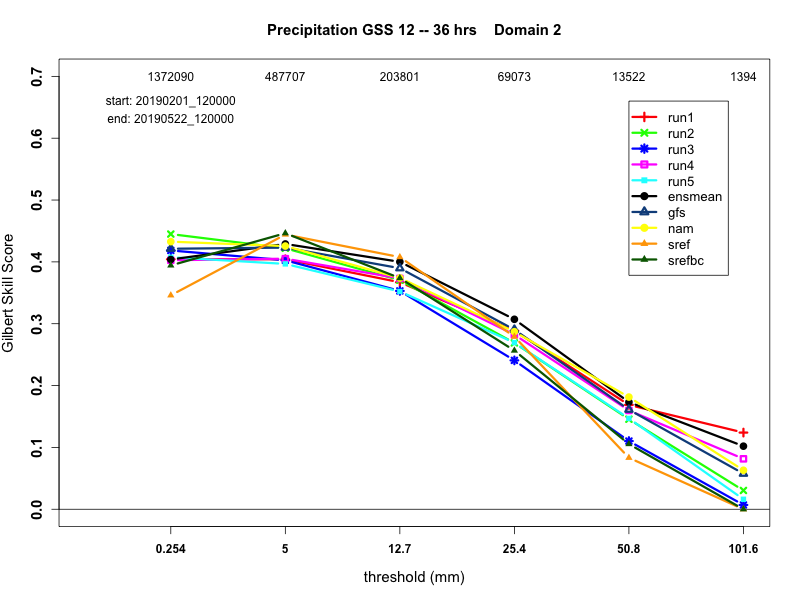
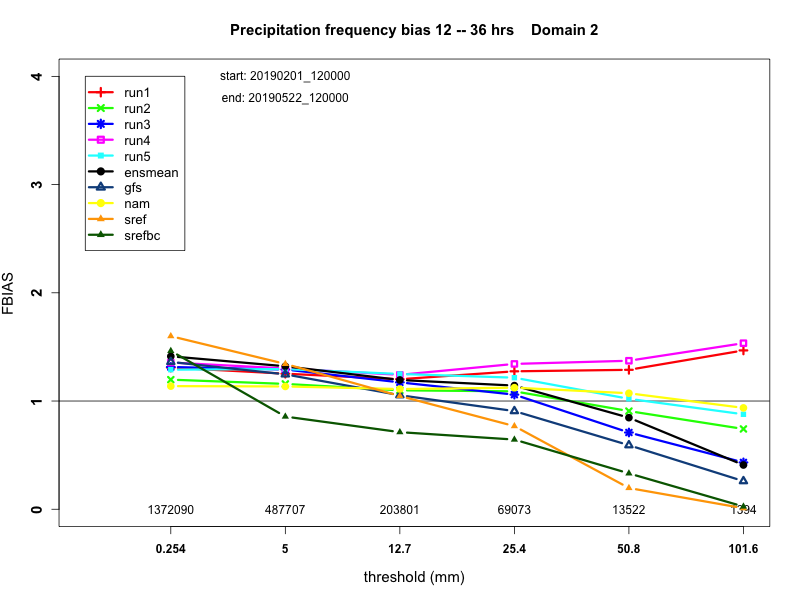
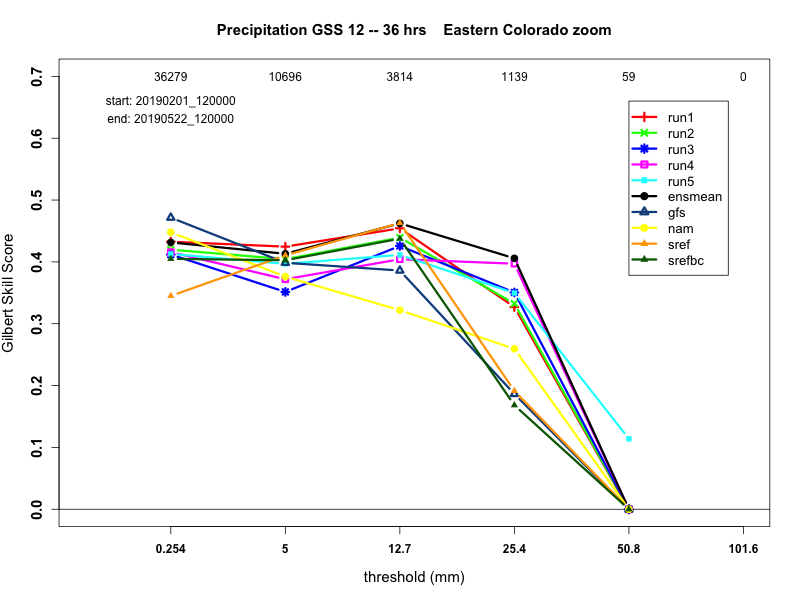
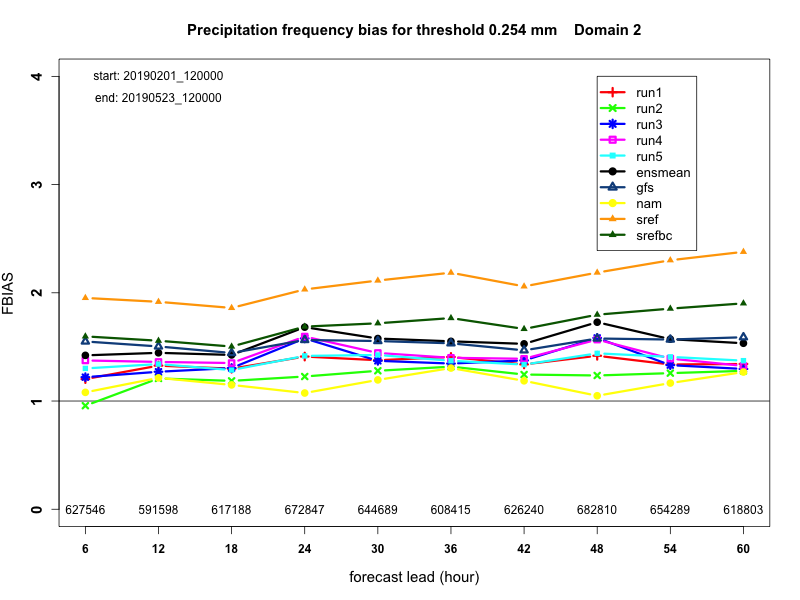
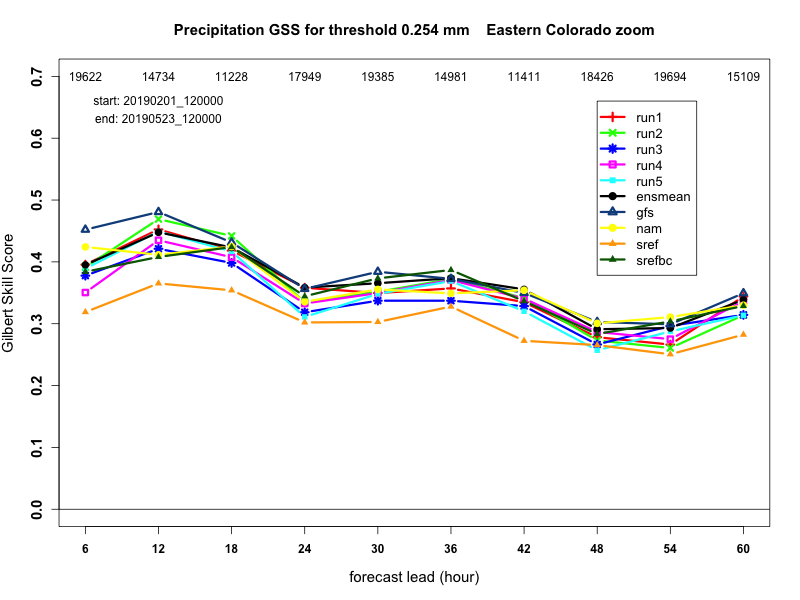
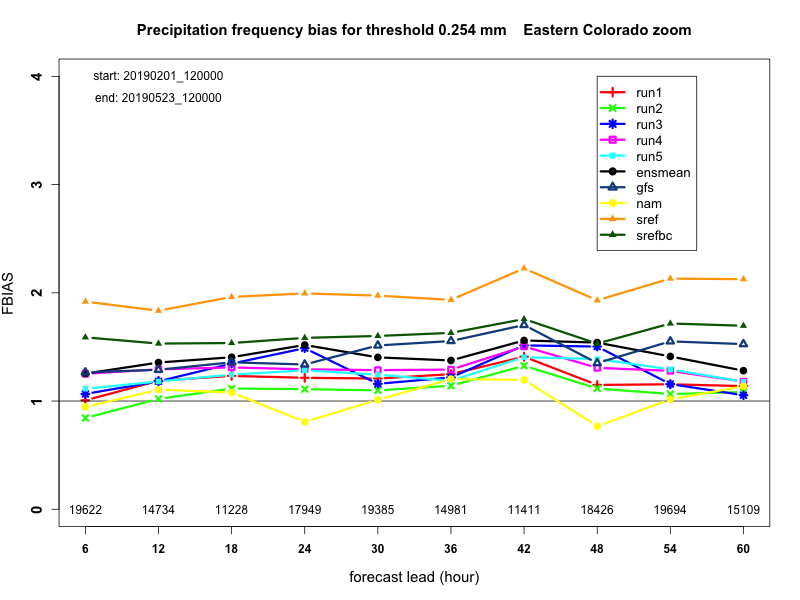
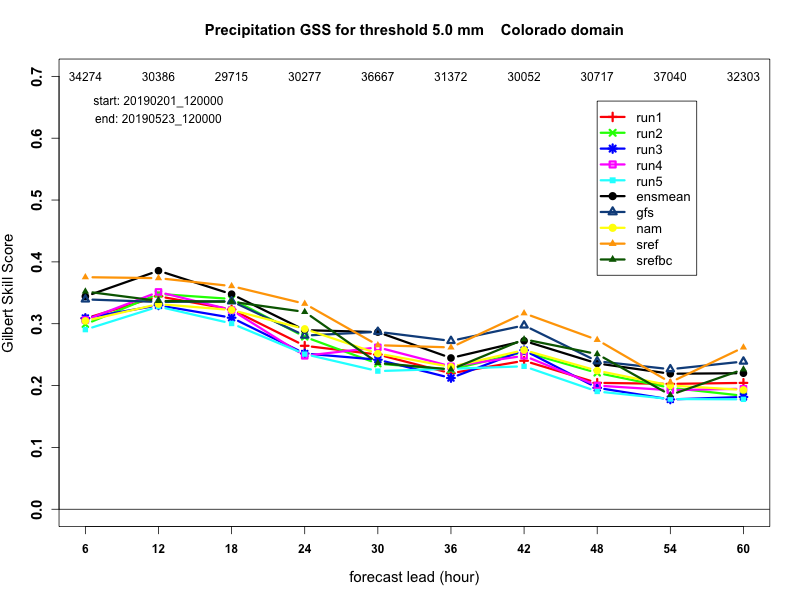
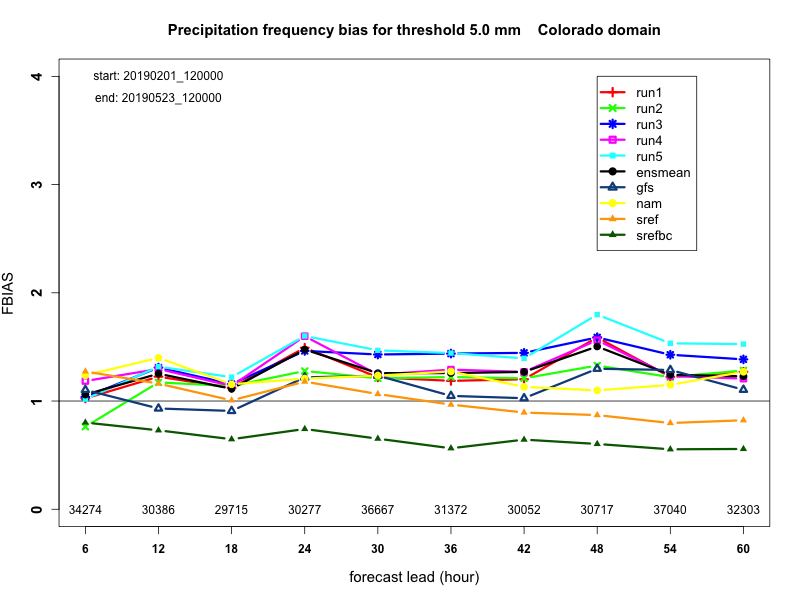
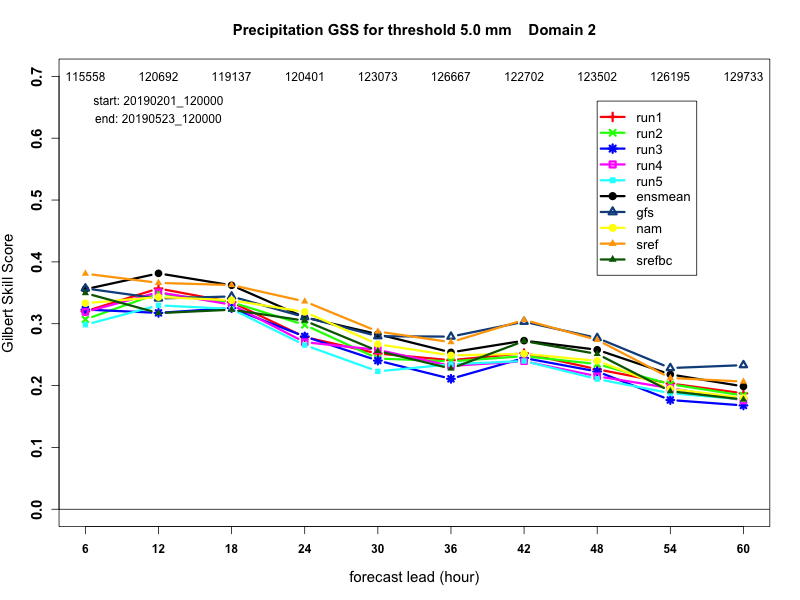
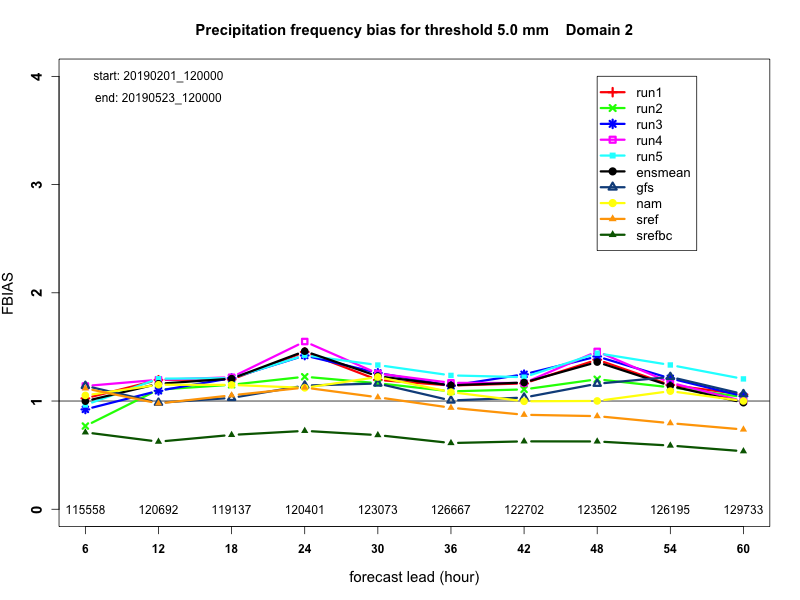
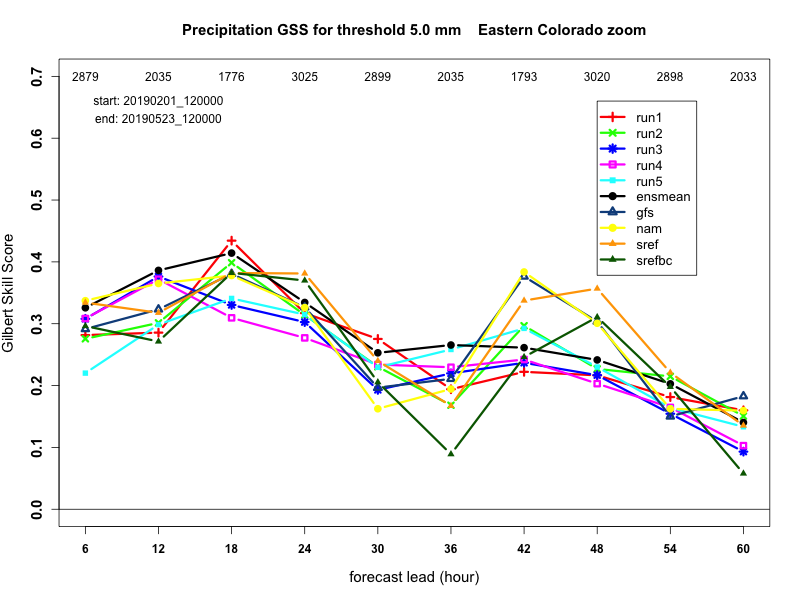
-- Forecasts are verified against the NCEP Stage IV precipitation analysis
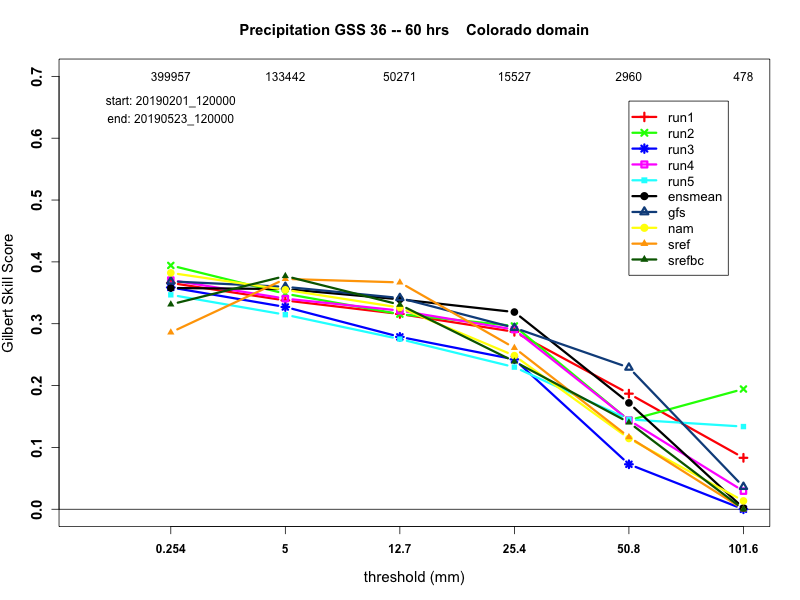
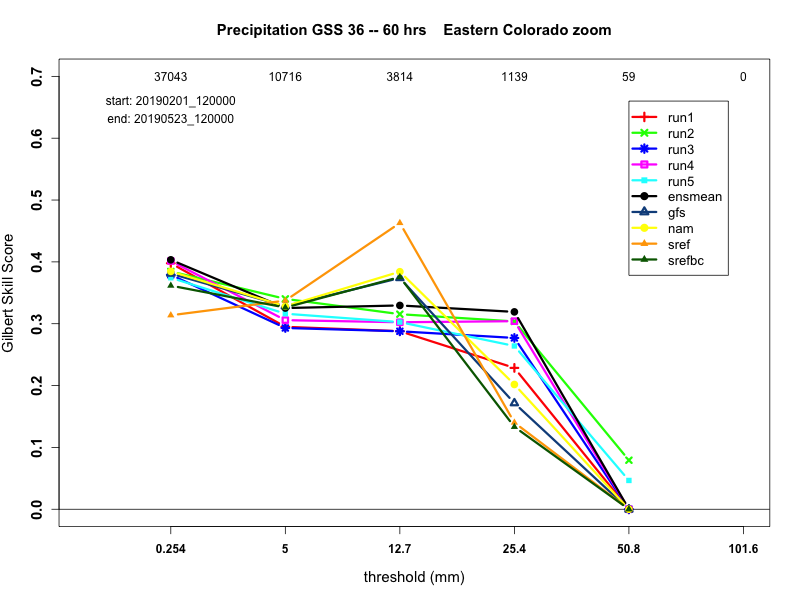
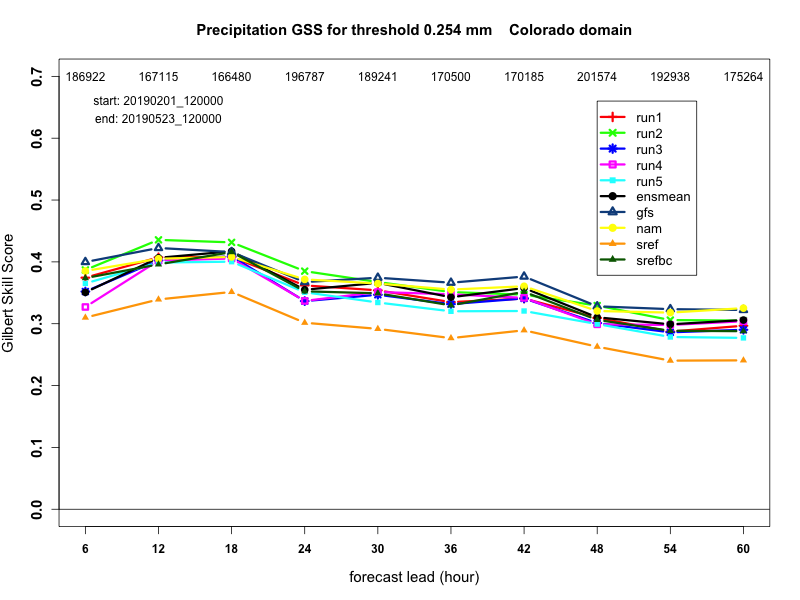
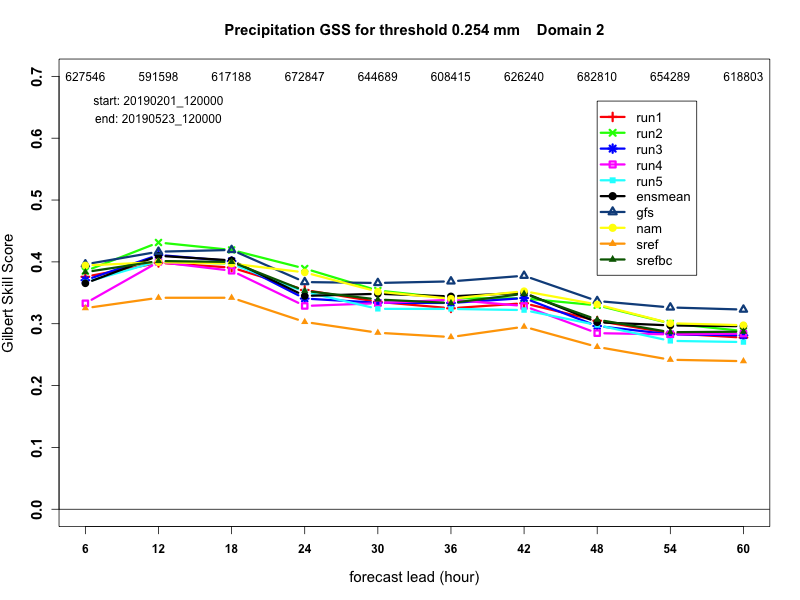
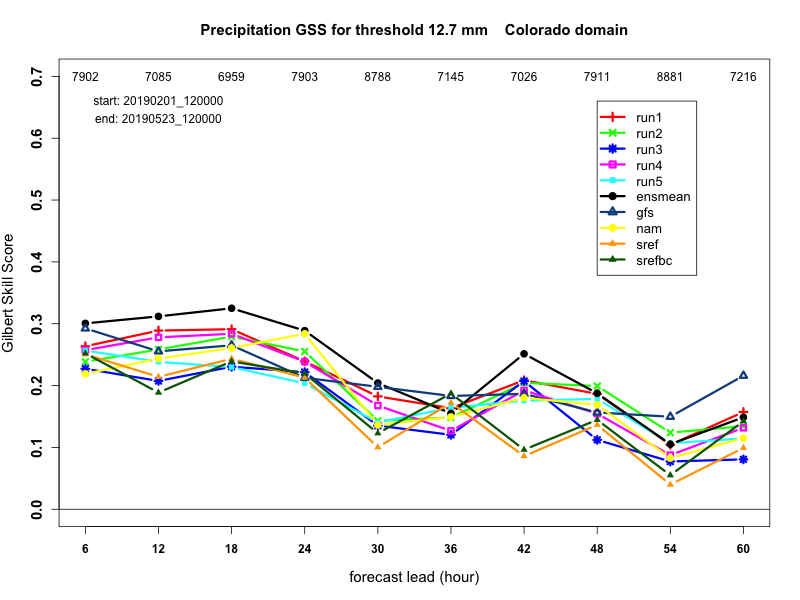
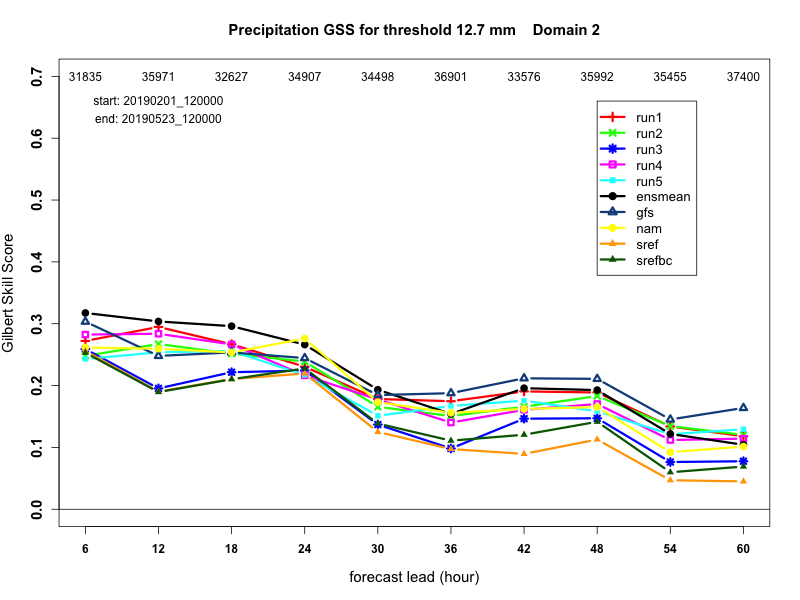
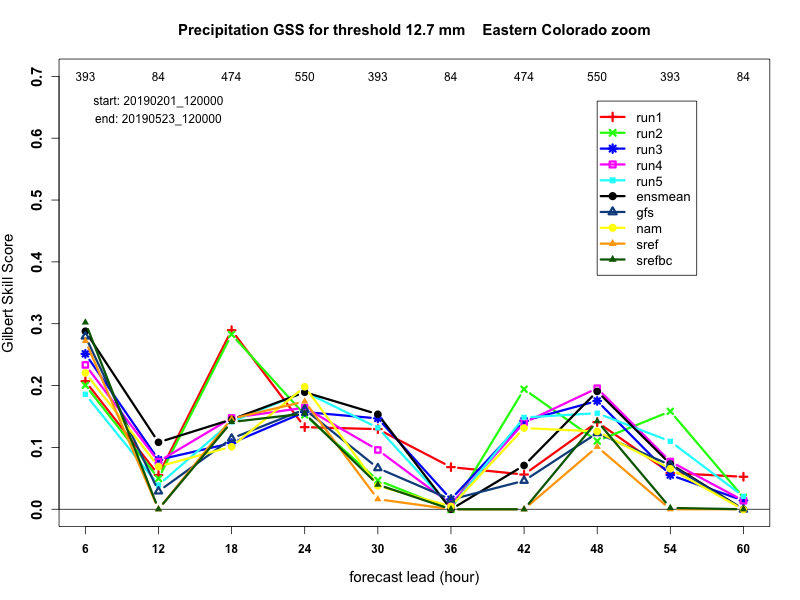
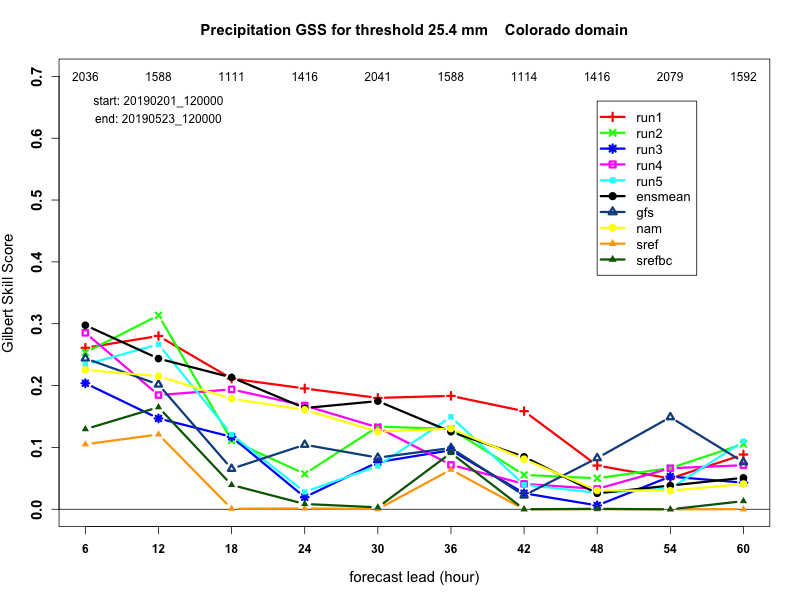
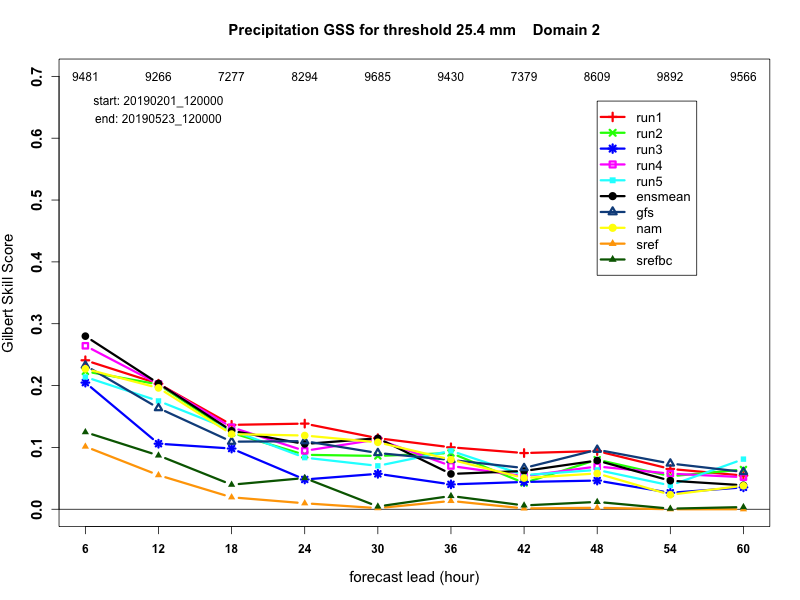
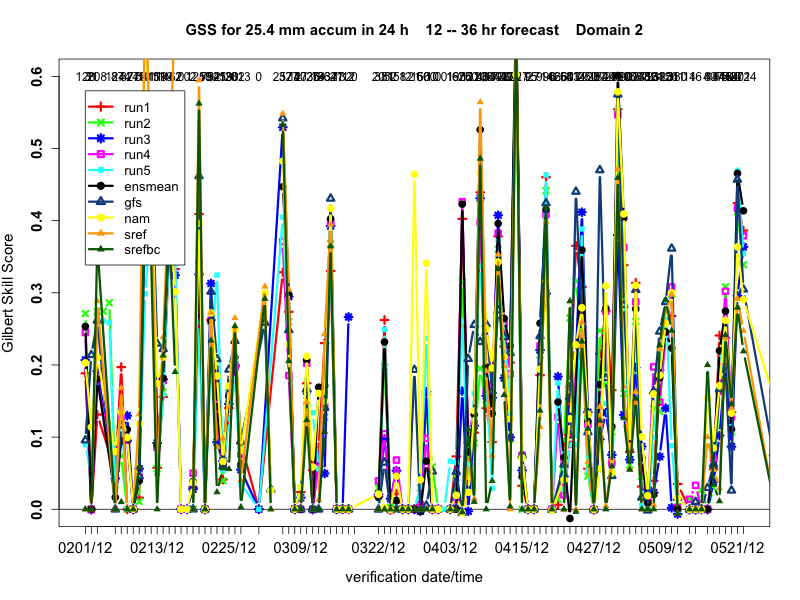
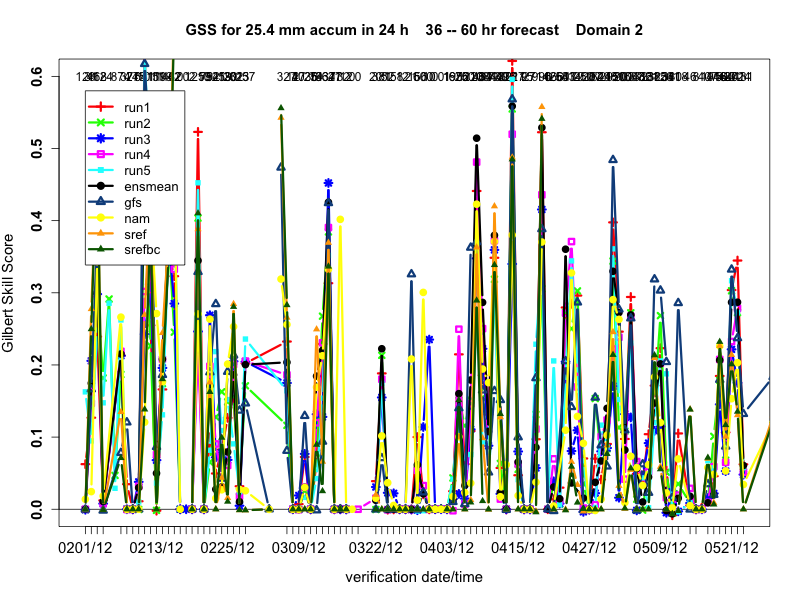
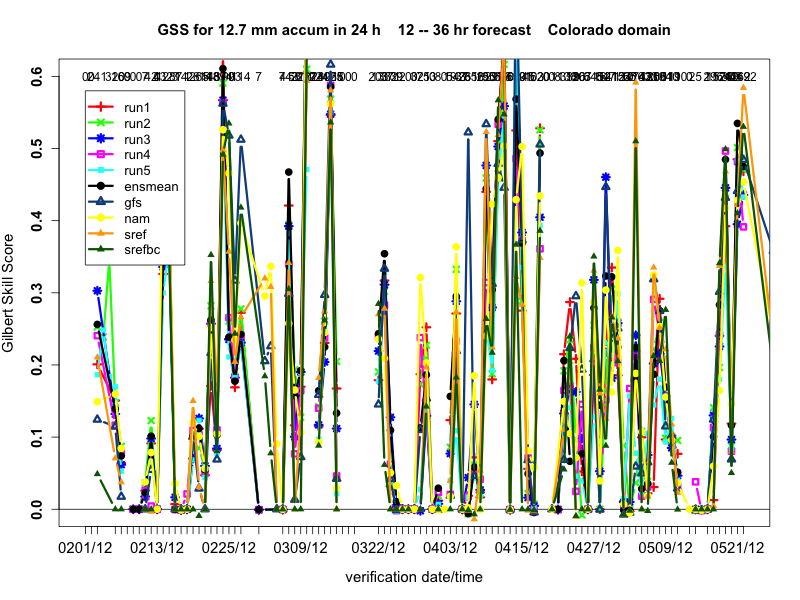
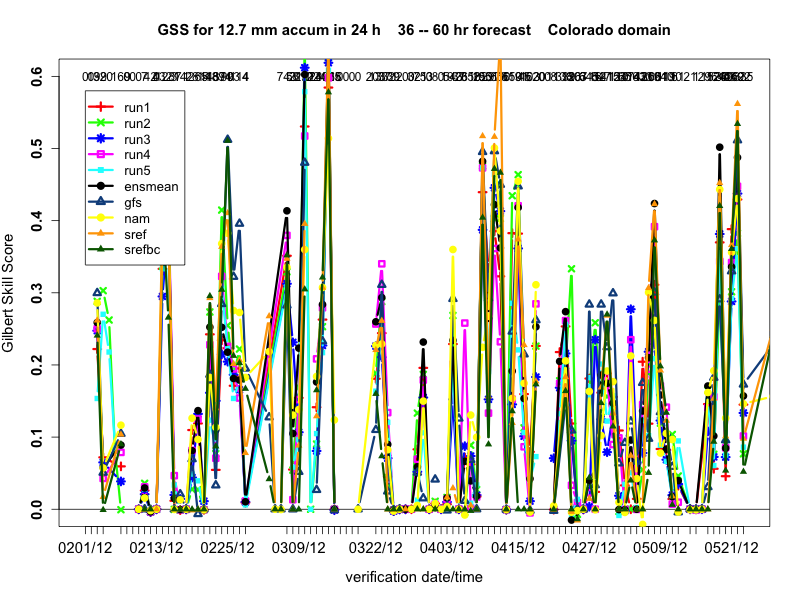
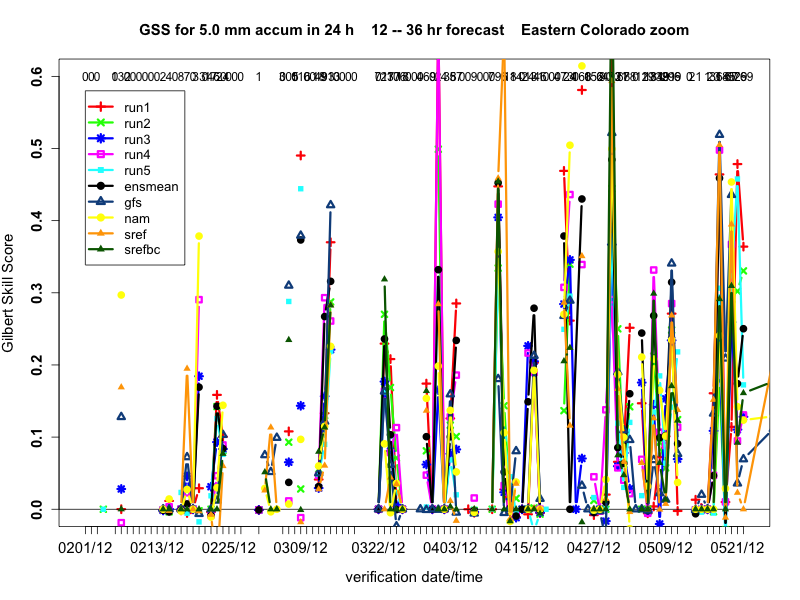
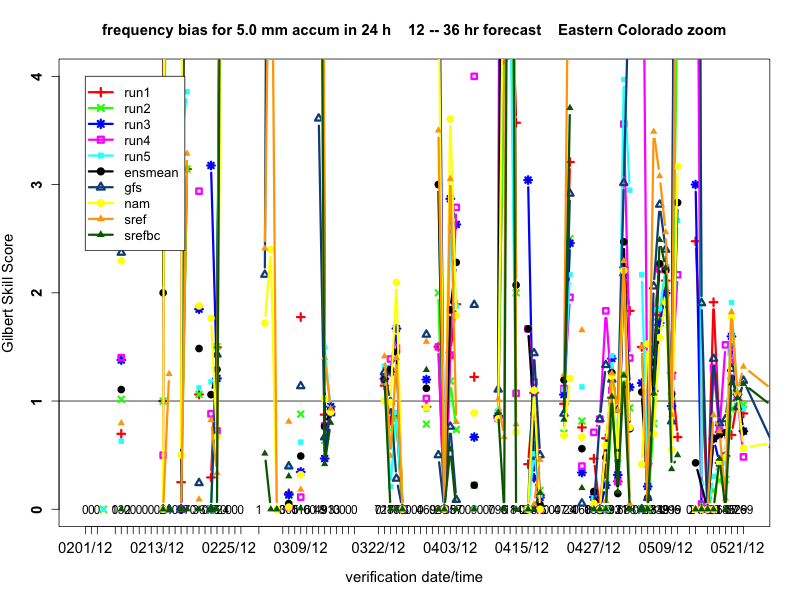
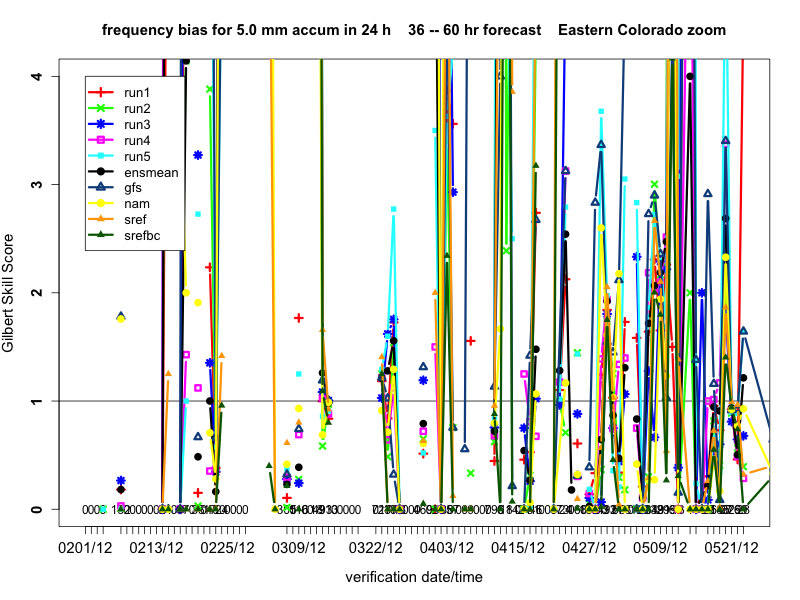
-- GSS = Gilbert Skill Score (also known as Equitable Threat Score), higher scores are better, 1 is perfect
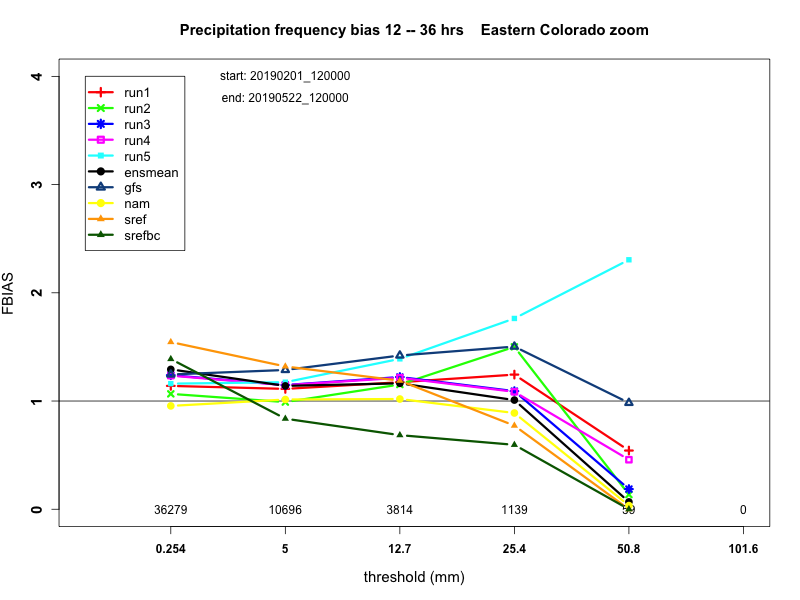
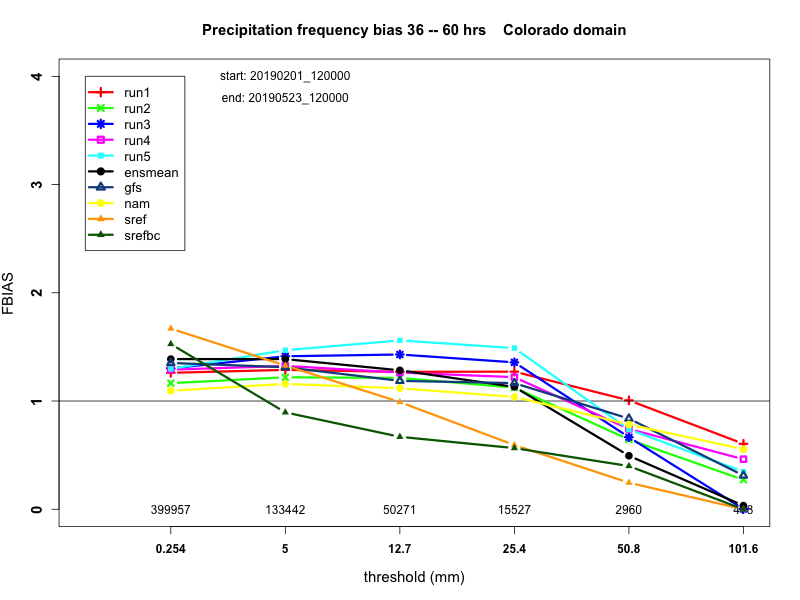
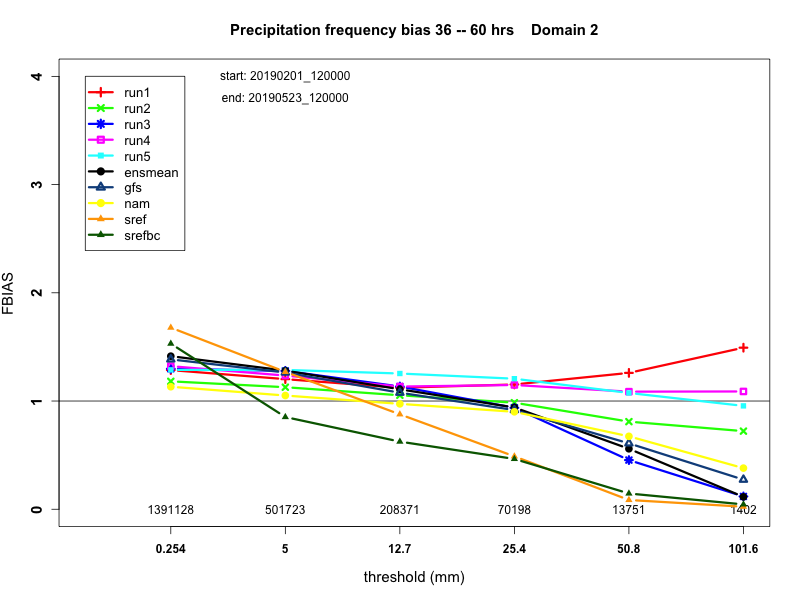
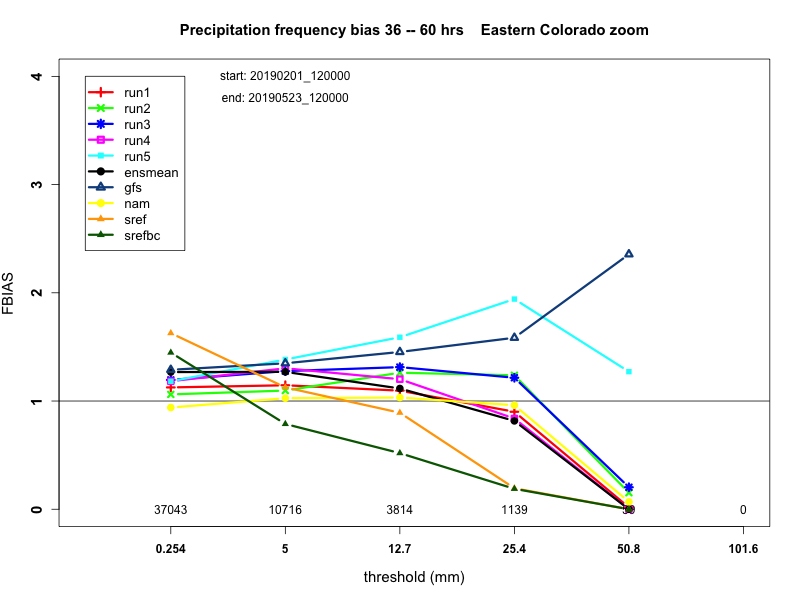
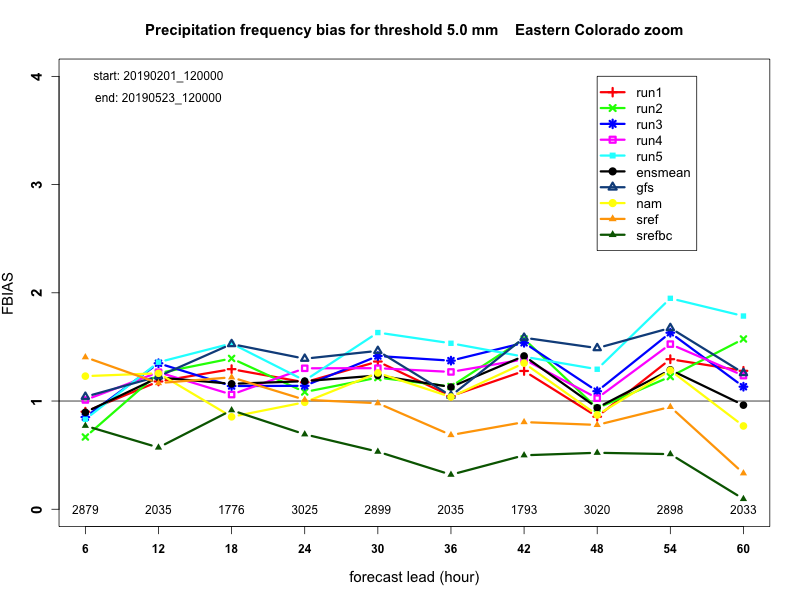
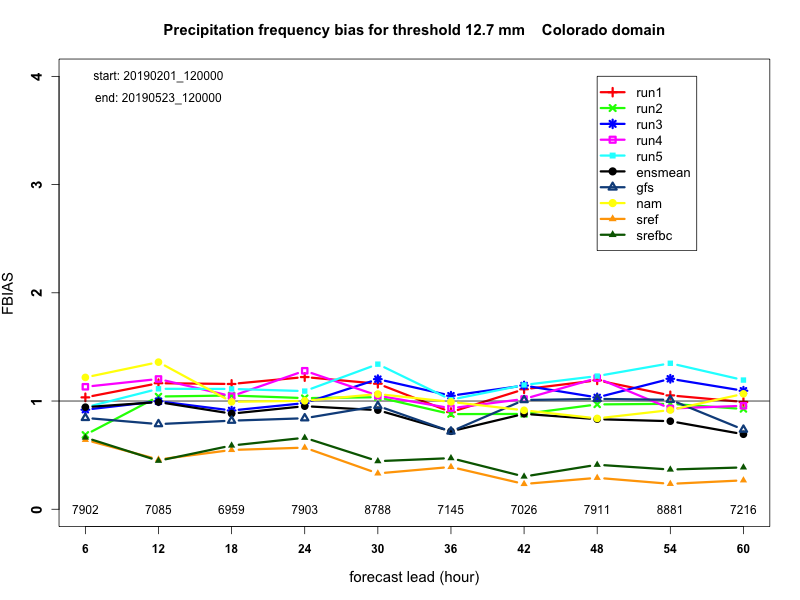
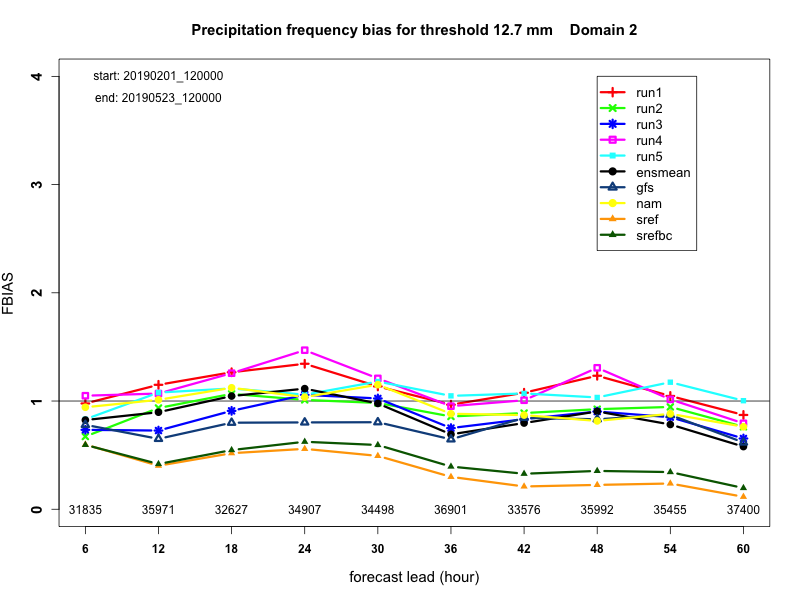
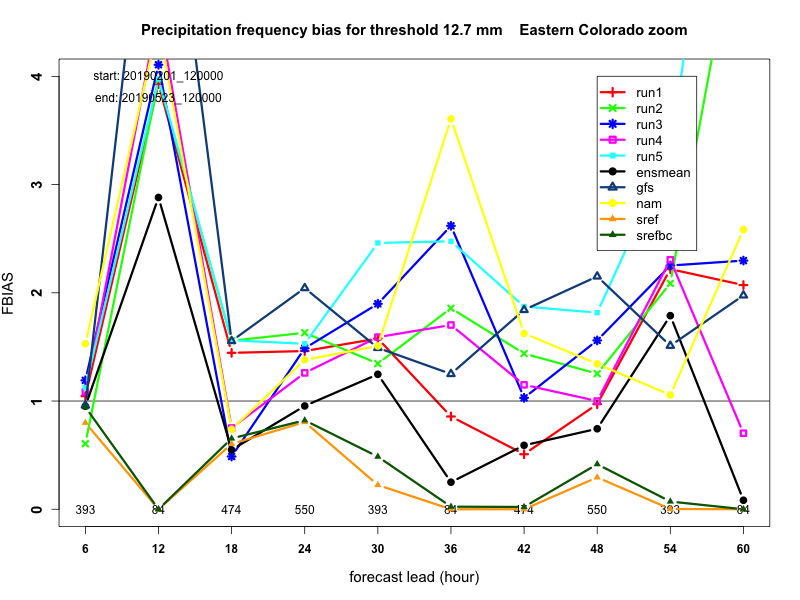
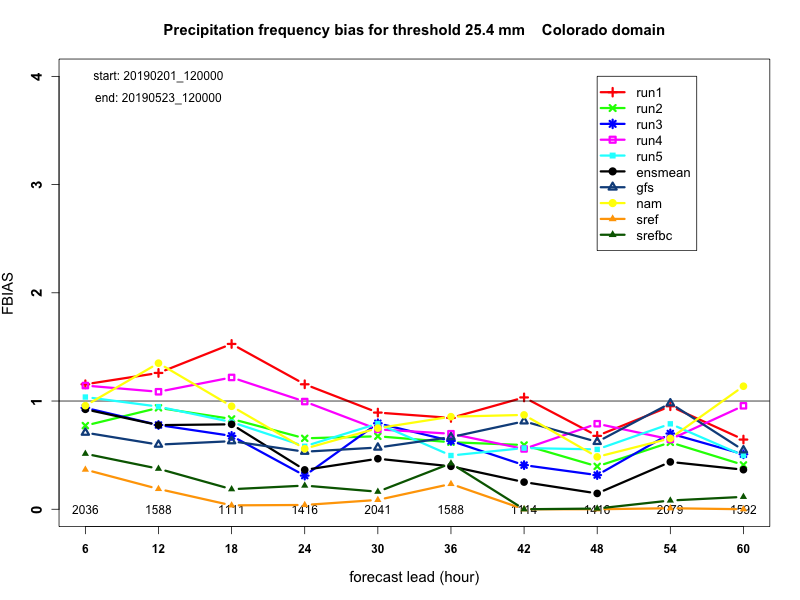
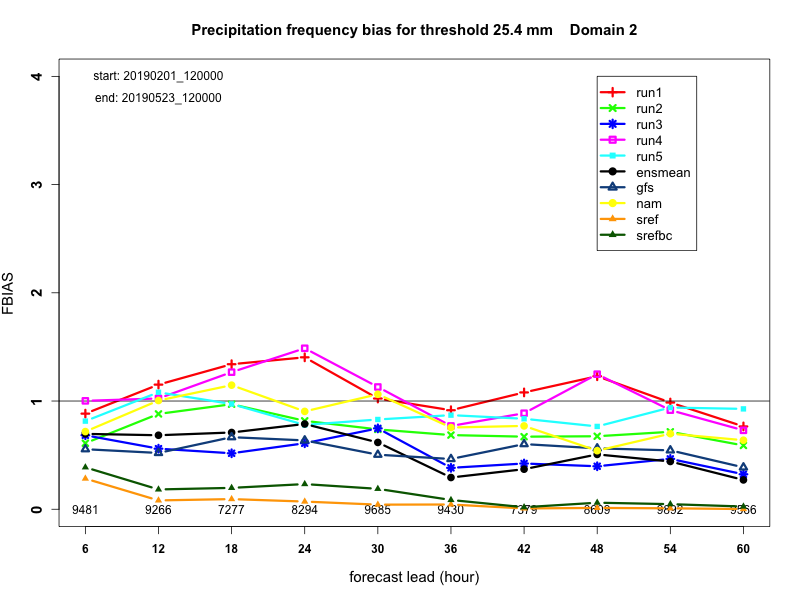
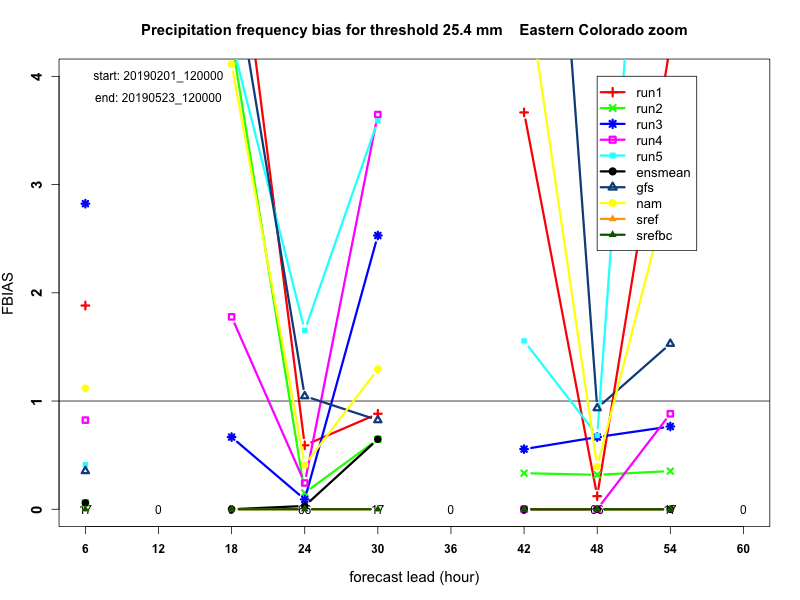
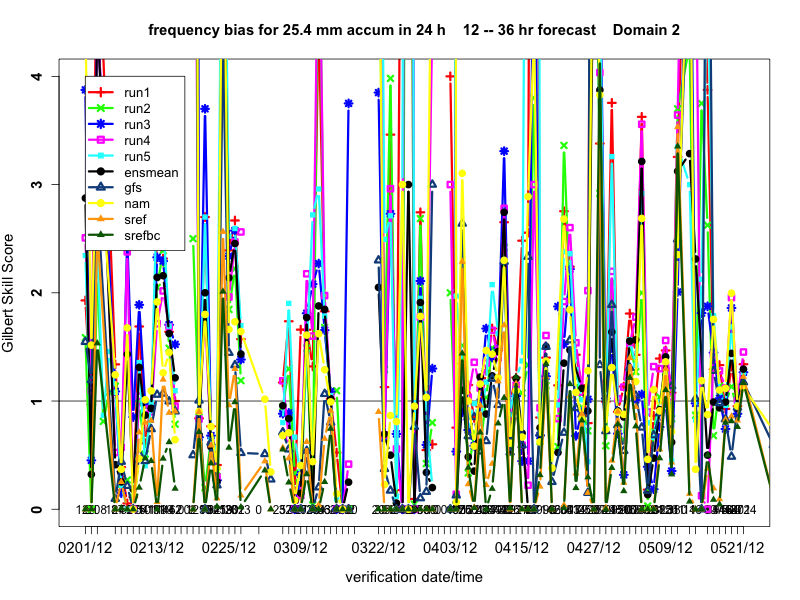
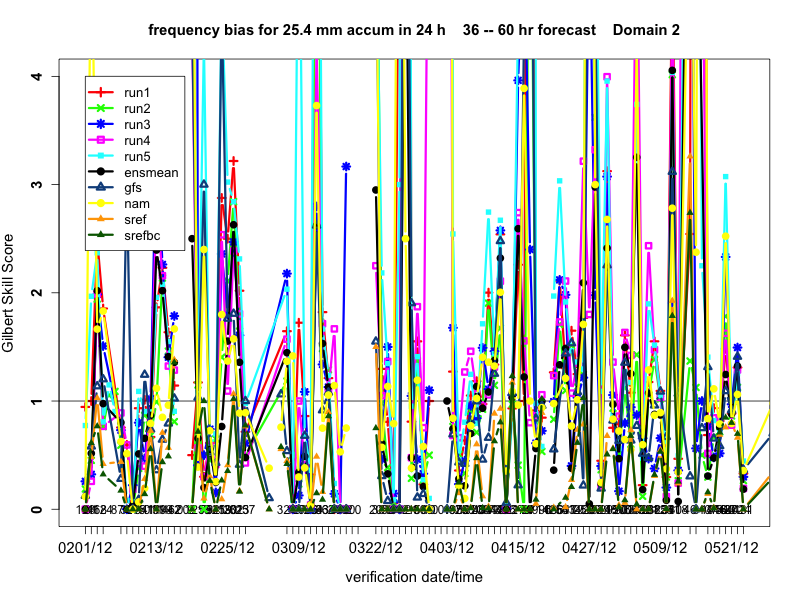
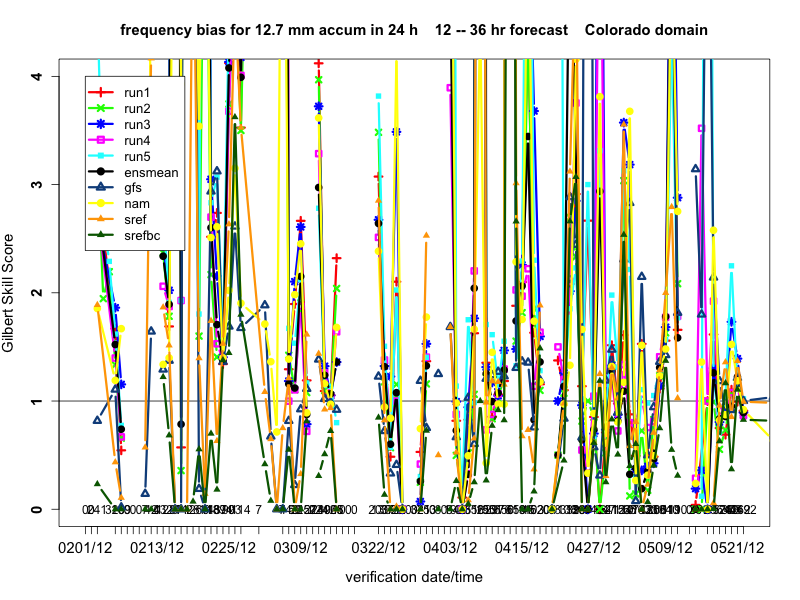
-- Bias = Frequency bias, the closer to 1 the better; values above 1 indicate the model predicts that amount of precip too frequently
-- Left two columns show statistics for a subdomain centered on Fort Collins, shown in these maps.
-- Right two columns show statistics for all of domain 2 (12-km grid spacing), which is the inner grid shown here. It covers much of the western and central US.
-- The "Eastern Colorado zoom" domain is a model subdomain covering only eastern Colorado and parts of eastern Wyoming and western Nebraska, shown here.
-- The top four rows show GSS and bias for 24-h precipitation forecasts versus accumulation threshold.
-- The next set of rows show GSS and bias for 6-h precip forecasts versus lead time at different accumulation thresholds.
-- At the very bottom are time series of GSS and bias for the 24-h accumulation, showing how the forecasts performed from day to day.
-- Scores are calculated using the Meteorological Evaluation Tools software package.
12--36-hour precipitation forecast
36--60-hour precipitation forecast
Time series: 0.254 mm (0.01 inch) in 6 hr
Time series: 5.0 mm (0.2 inch) in 6 hr
Time series: 12.7 mm (0.5 inch) in 6 hr
Time series: 25.4 mm (1.0 inch) in 6 hr
Time series: GSS and bias vs. date for 25.4 mm in 24 hours (full domain 2)
Time series: GSS and bias vs. date for 12.7 mm in 24 hours (Colorado domain)
Time series: GSS and bias vs. date for 5.0 mm in 24 hours (eastern Colorado zoom)


