
Real-time monitoring of heavy precipitation
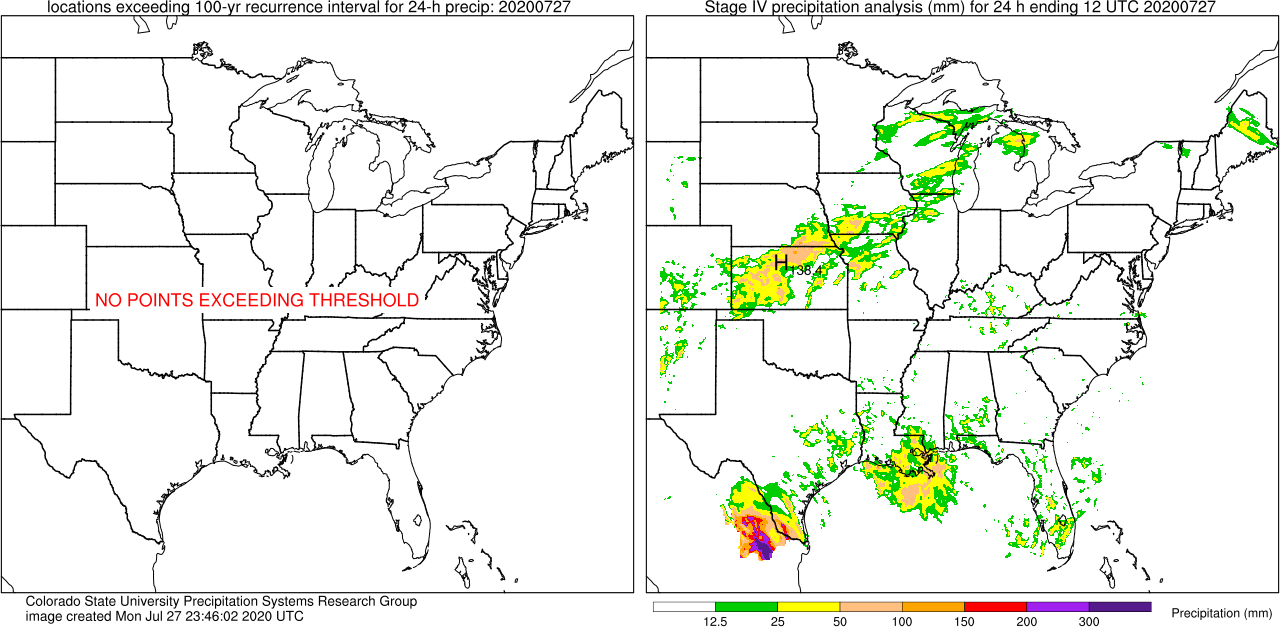
These images show locations where the 100-year recurrence interval for 24-h precipitation has been exceeded. This is an automated search for the types of events discussed in Schumacher and Johnson (2005, 2006) and Stevenson and Schumacher (2014), using gridded precipitation analyses. The current image is below, with a link to past days when the threshold has been exceeded. Images are created at around 1545 UTC each day, and then updated multiple times to incorporate updated data.
UPDATE, 21 December 2018: The threshold maps have now been updated to include NOAA's updates to Atlas 14 that include Texas. Maps after this date will include the updated Texas thresholds. We are in the process of re-running past cases to include these as well; an update will be posted here when this is completed.
Switch to a different threshold:
Current image
Click here to see the threshold
