Colorado State University
Real-Time Weather Data
Precip. Sys. Research Group
Colorado State University
Real-Time Weather Data
Precip. Sys. Research Group
Colorado State University
Real-Time Weather Data
Precipitation Systems Research Group
Skip navigation
  • Home
  • CSU WRF Forecasts
    • 12-km Ensemble: CO
    • 12-km Forecast Soundings
    • 4-km Forecast
    • 4-km Forecast: WxC Zoom
    • 4-km Forecast Soundings
    • 12-km Model Information
    • 4-km Model Information
  • CSU Machine Learning Forecasts
    • CSU-MLP (precip)
    • CSU-MLP (severe weather)
    • downslope windstorms
  • Model Forecasts
    • GFS
    • NAM
    • GEFS
    • NAM 3-km Nest
    • HRRR
    • ECMWF
    • AIWeather
  • Heavy Precip
    • ARI Monitoring
    • TORFF Identification
  • Links
    • Fort Collins Weather Station
    • Christman Field Wx Station
    • CoAgMET
    • NWS Denver/Boulder
    • NWS Cheyenne
    • CIRA SLIDER satellite imagery
    • Fort Collins Rain Gauges

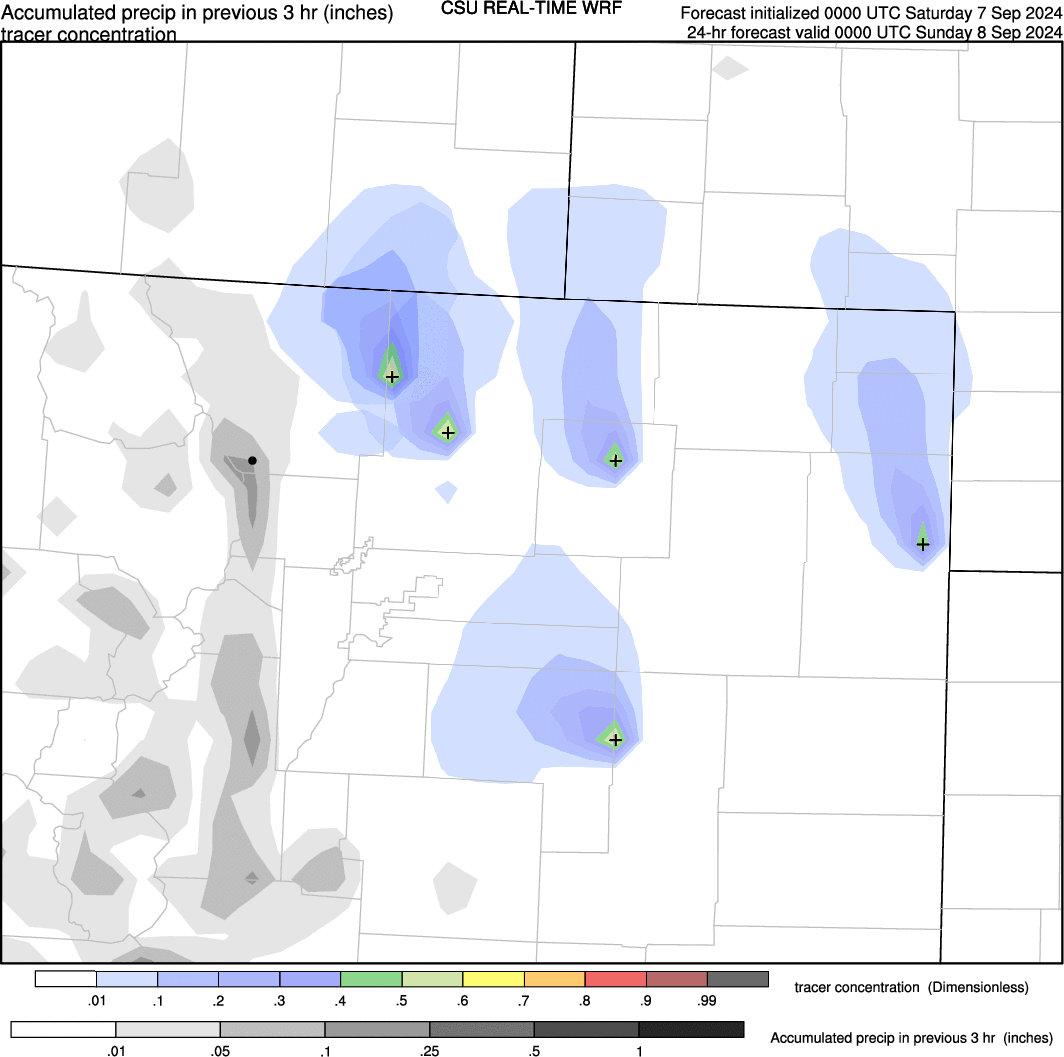
CSU WRF model forecasts: model comparison for Colorado

The current run was initialized at 0000 UTC Saturday February 7 2026.

84-hour total precipitation
84-hour total precipitation (all of domain 2)
MSLP, 1000–500-hPa thickness, 3-hour precip (click image for animation)
MSLP, 1000–500-hPa thickness, 3-hour precip (all of domain 2) (click image for animation)
MSLP, surface temperature, and winds (click image for animation)
MSLP, surface temperature, and winds (all of domain 2) (click image for animation)
MSLP, surface dewpoint, and winds (click image for animation)
MSLP, surface dewpoint, and winds (all of domain 2) (click image for animation)
10-meter wind speed (click image for animation)
10-meter wind speed (all of domain 2) (click image for animation)
700-mb heights and wind speed (click image for animation)
700-mb heights and wind speed (all of domain 2) (click image for animation)
Precipitable water (click image for animation)
Precipitable water (all of domain 2) (click image for animation)
Mean-layer CAPE and 0–6-km vector wind shear (click image for animation)
precipitation type and MSLP (click image for animation)
West-to-east vertical section through Fort Collins of potential temperature and winds (click image for animation)
Surface temperature time series at Fort Collins
3-hour precipitation time series at Fort Collins
Accumulated precipitation time series at Fort Collins
10-meter wind speed time series at Fort Collins

New interactive graphs!


Forecast soundings (click on the image for a loop of forecast soundings at Fort Collins, use the menu to select different locations.)

Tracer concentrations from source locations in eastern Colorado (click on the image for a loop from CSU WRF run 1; use the menu to select different model runs.)

Unidata badge

DISCLAIMER: The images and data on this site are intended for meteorological education and research purposes and, although they should generally be up to date, are not monitored at all times. Do not use for making decisions where money or lives are at stake. For official forecasts and warnings, visit the National Weather Service.

Walter Scott, Jr.
College of Engineering
Research Group Home People Research Teaching Resources Contact
Precip. Systems Research Group
GIVE
Contact CSU Equal Opportunity Privacy Statement Disclaimer

© 2026 Colorado State University, Fort Collins, Colorado 80523 USA

© 2026 Colorado State University,
Fort Collins, Colorado 80523 USA

Colorado State University logo