
Real-time monitoring of heavy precipitation
NOTE: We now also have a site showing similar maps for the entire US, using Atlas 14 where available and older NOAA atlases where updated information is not yet available.
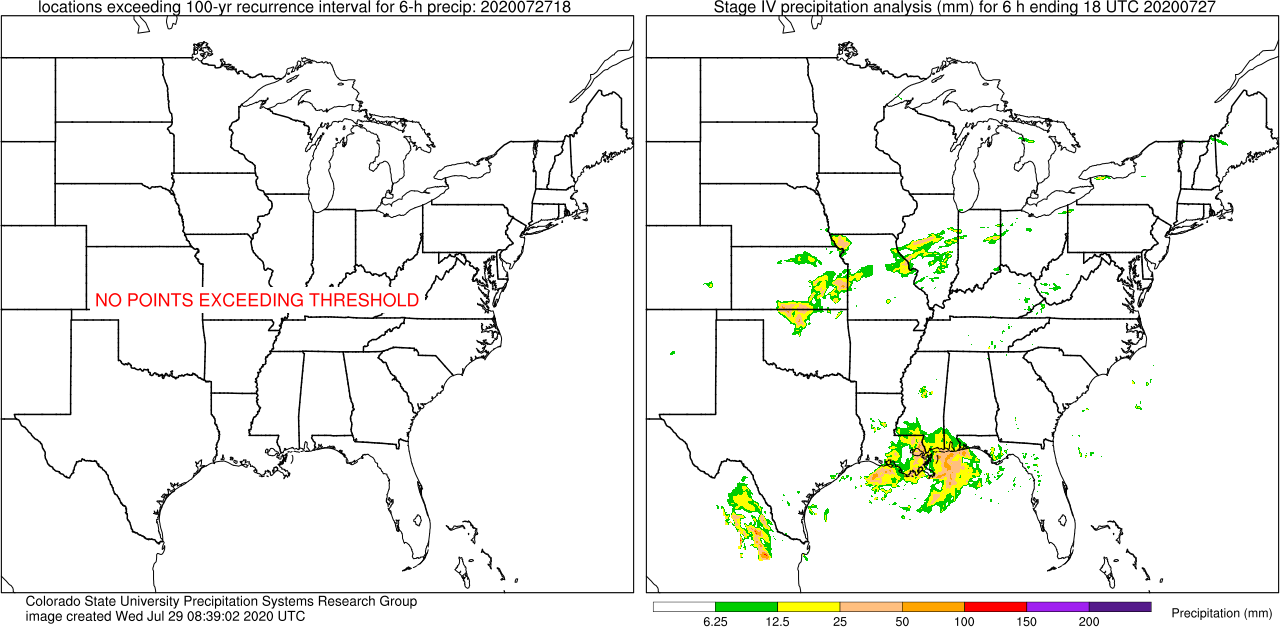
These images show locations where the 100-year recurrence interval for 6-h precipitation has been exceeded. The current image is below, with a link to days in the past when the threshold has been exceeded. The images will be created approximately 5 hrs 45 minutes after the end of the period shown (i.e., the 18 UTC data will appear around 2345 UTC), and then will check for updated stage IV data several times after that.
Switch to a different threshold:
Current image
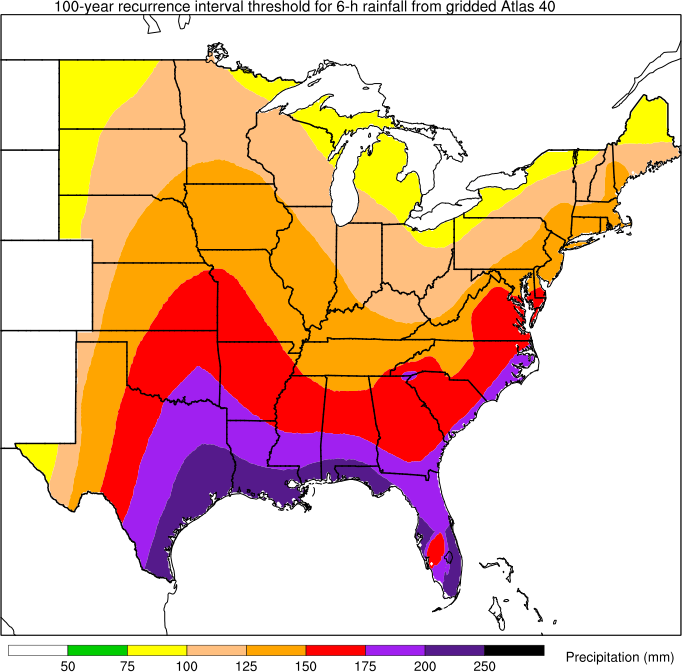
Click here to see the threshold
