NOTE: 24 October 2018: We are now running forecasts at 0000 and 1200 UTC each day in support of the RELAMPAGO field campaign! Other than the location of the domain, the configuration is the same as that described here.
The current run was initialized at 0000 UTC Friday February 1 2019.
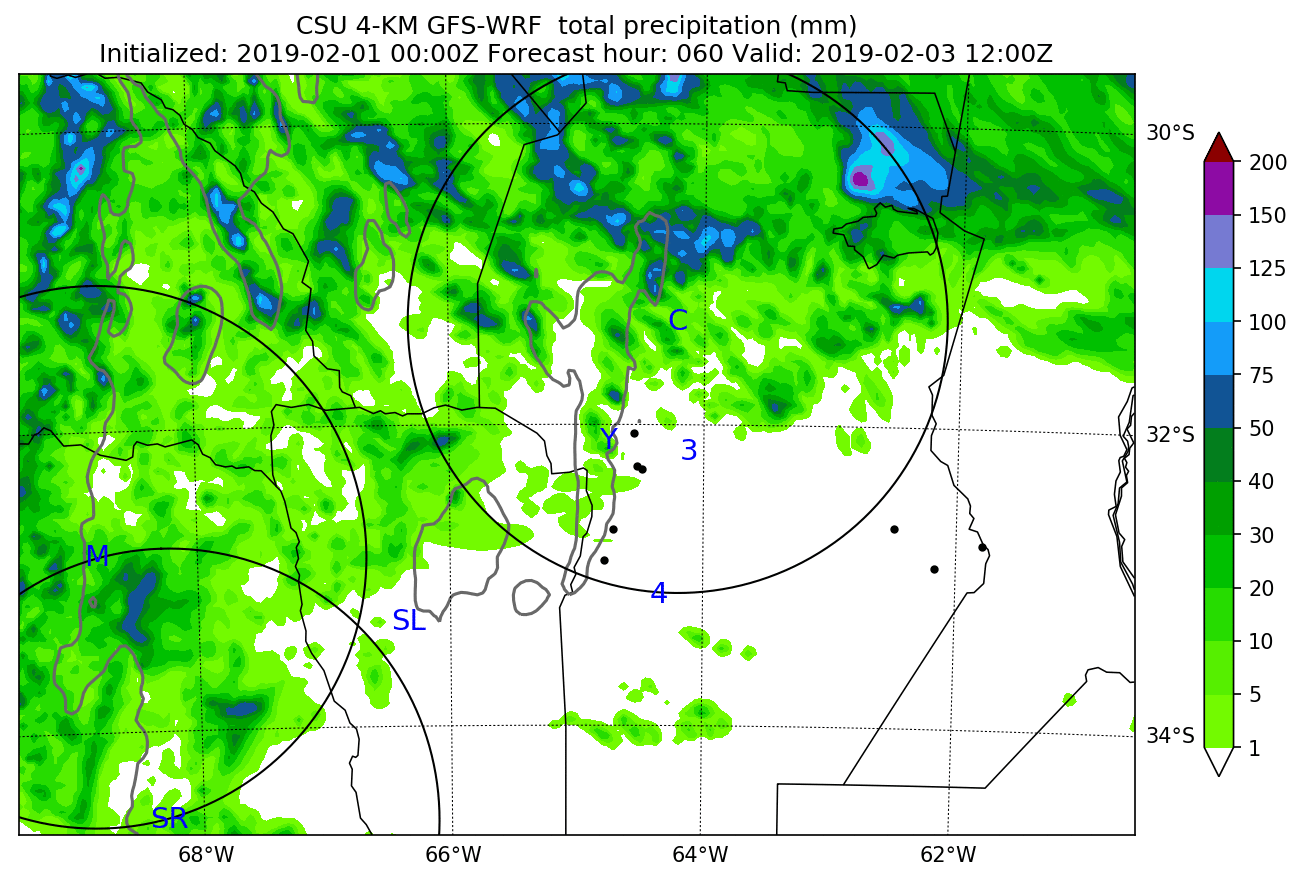
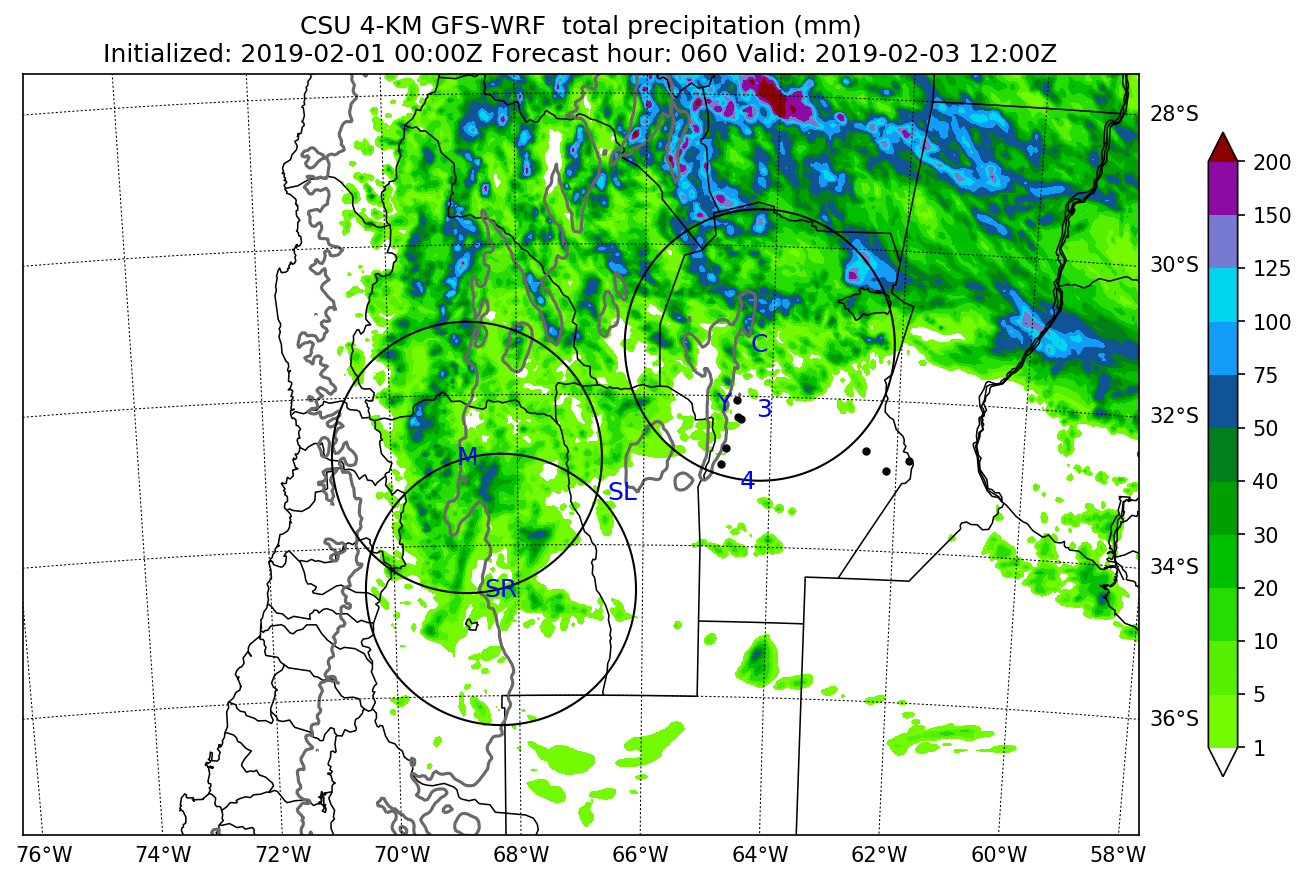
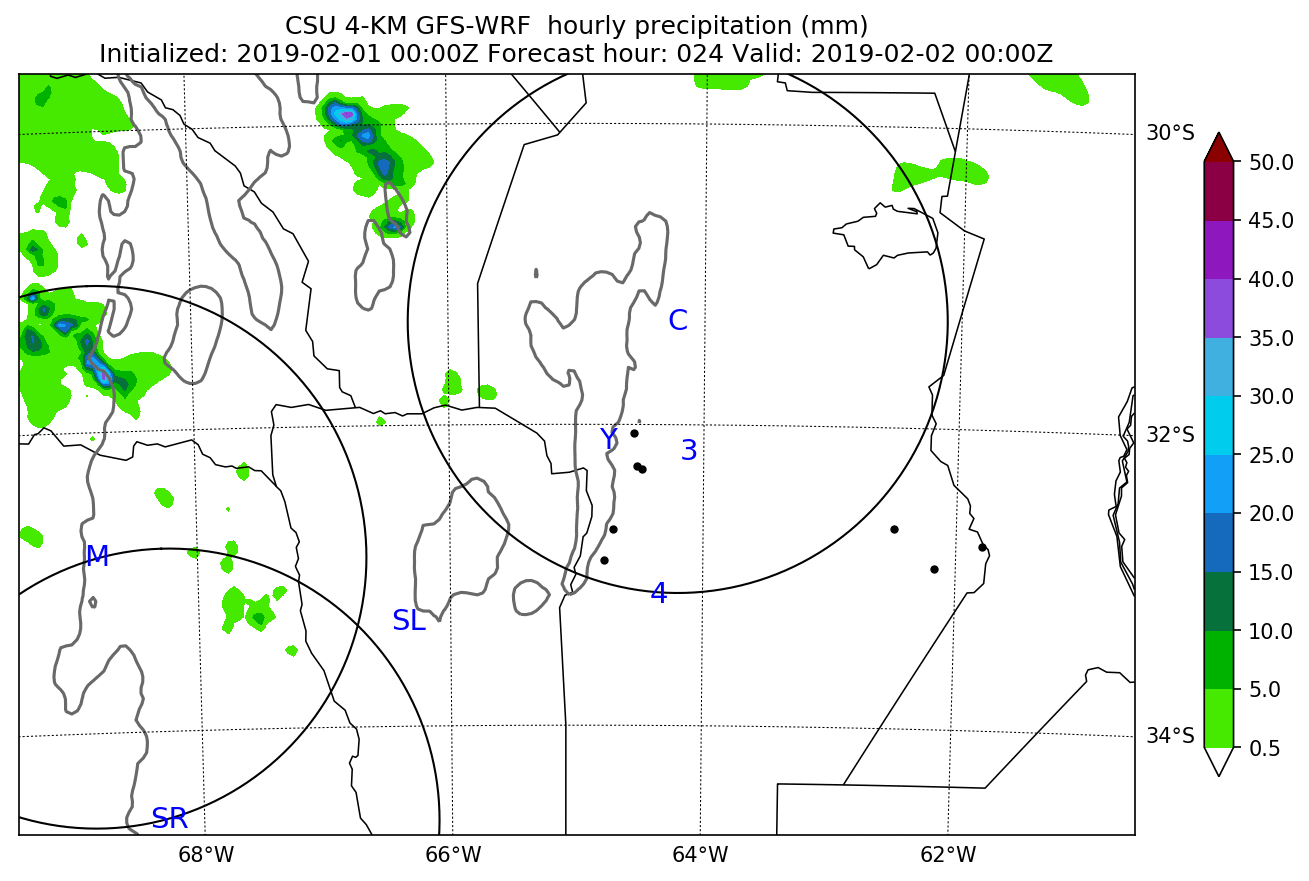
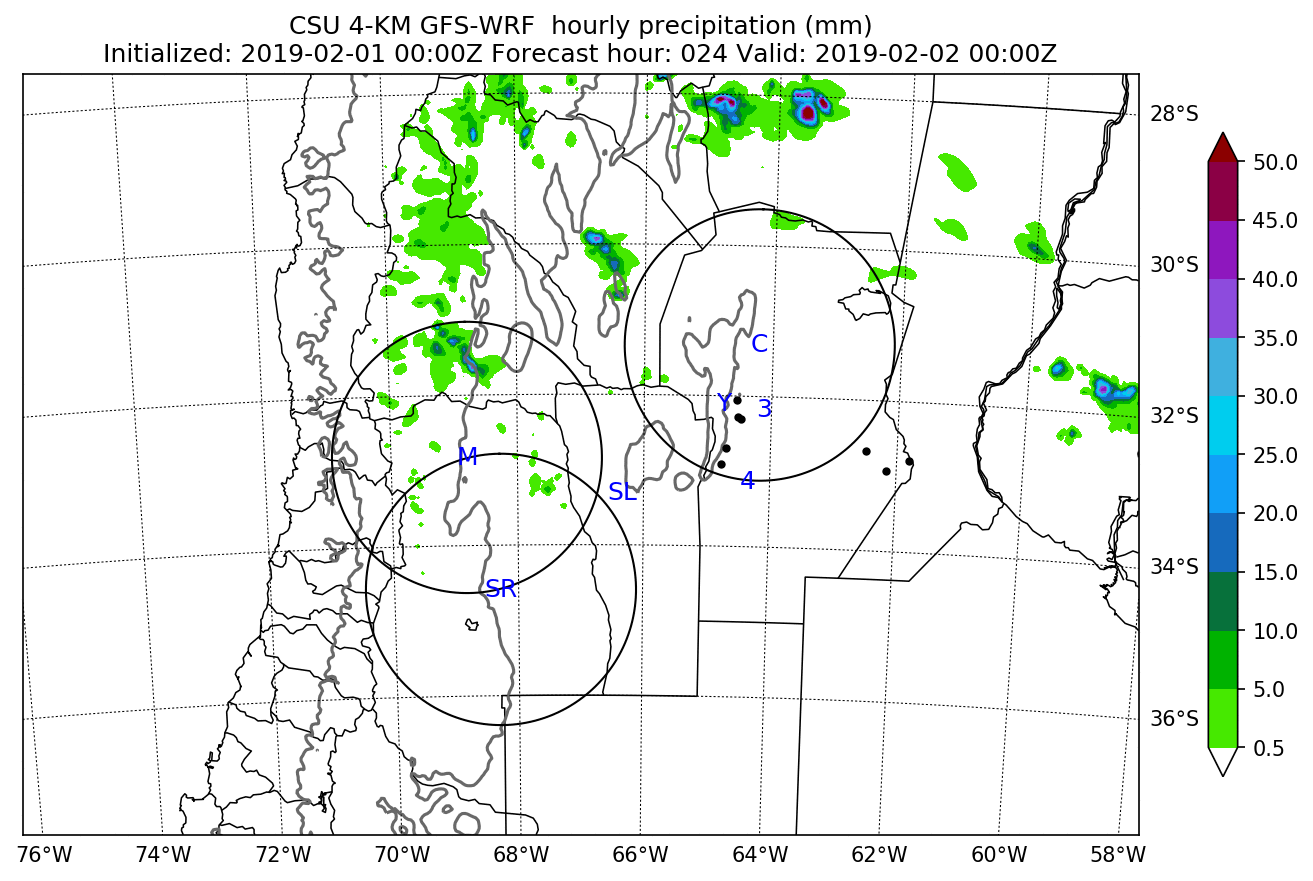
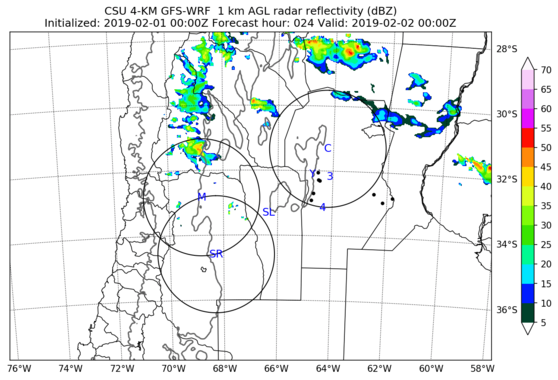
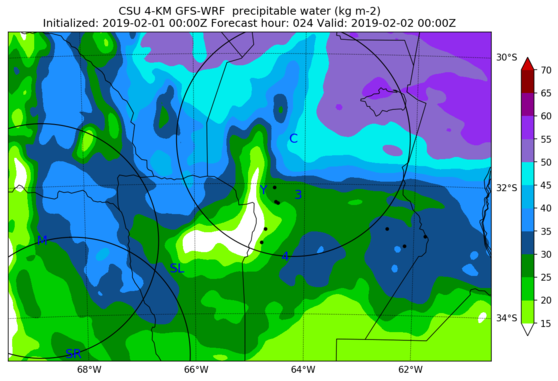
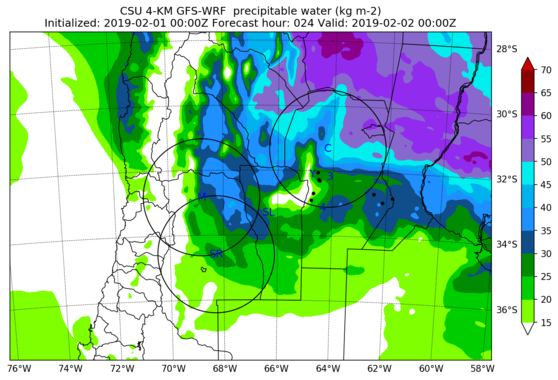
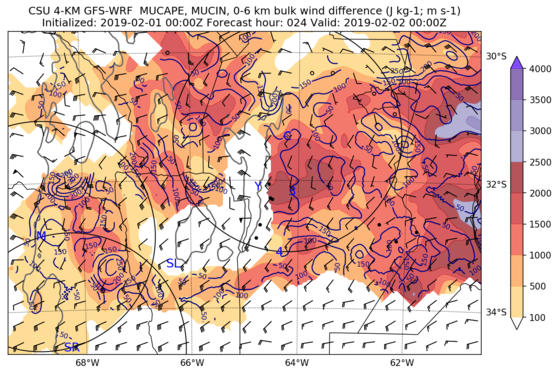
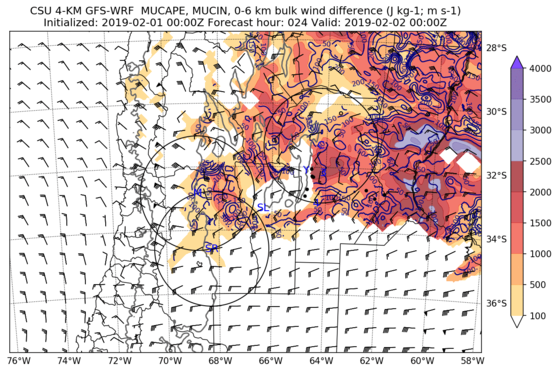
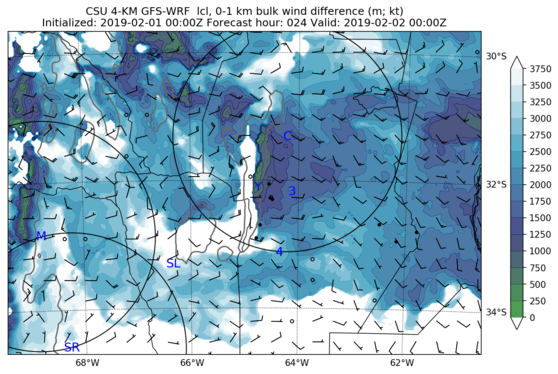
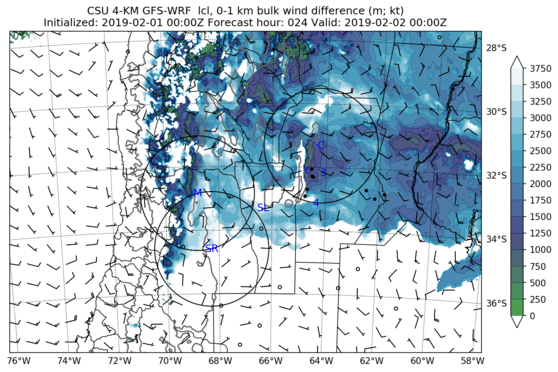
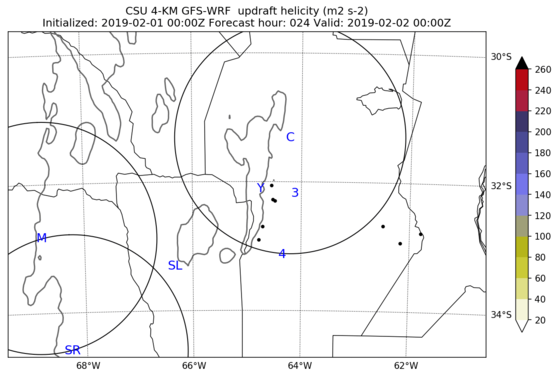
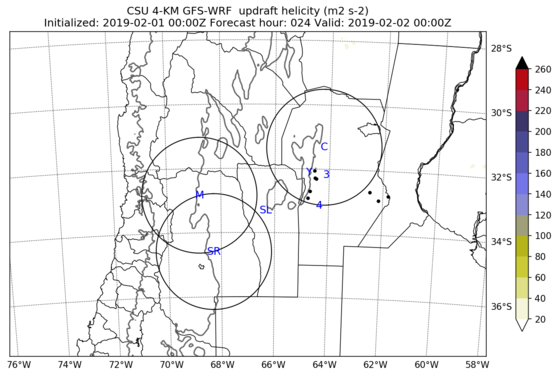
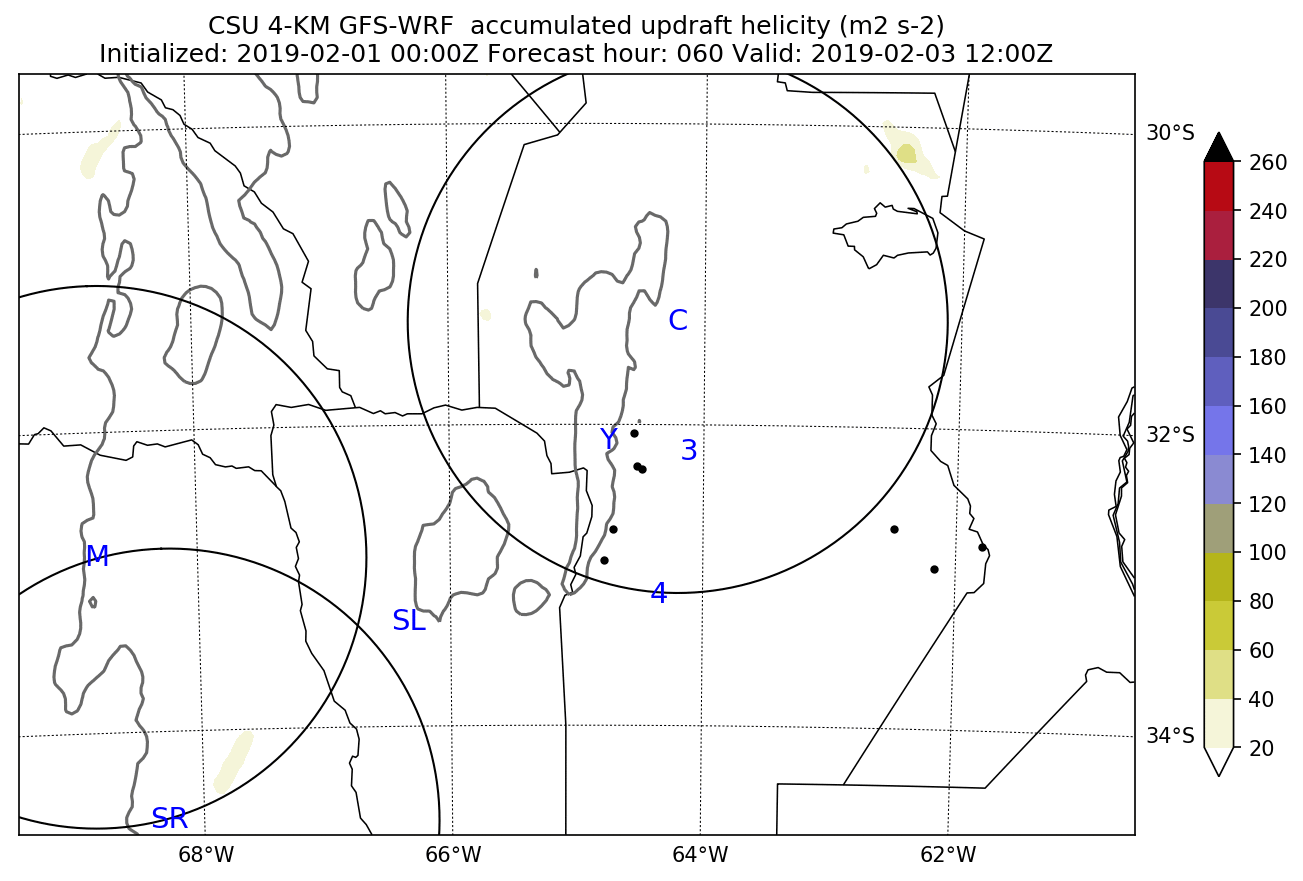
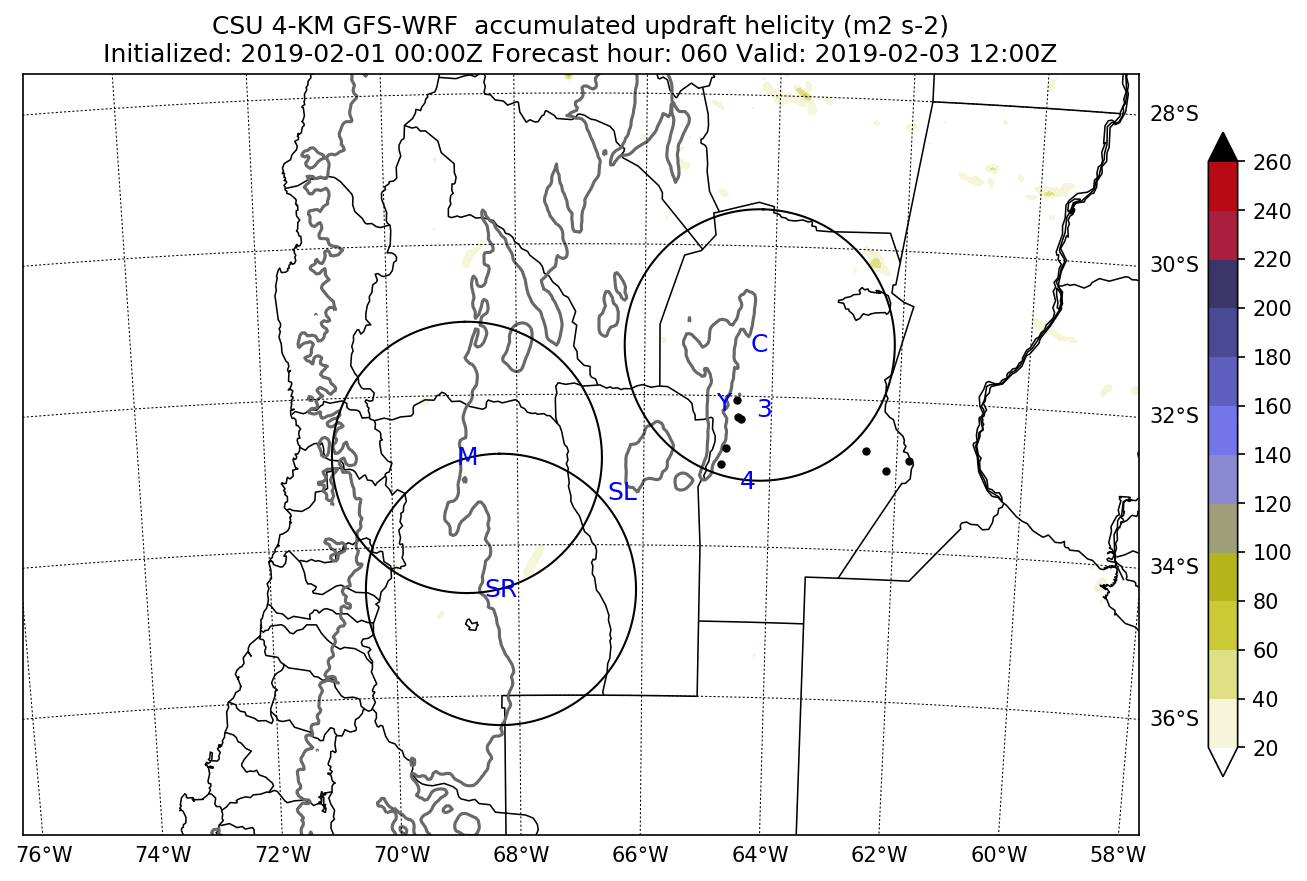
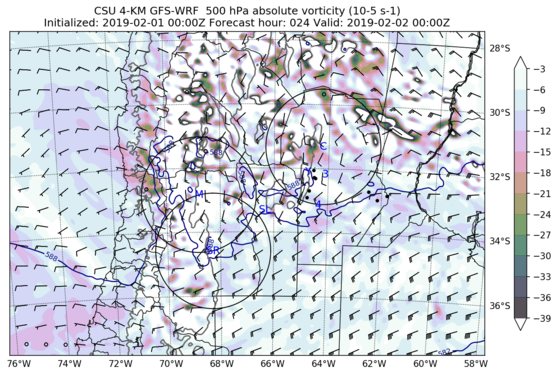
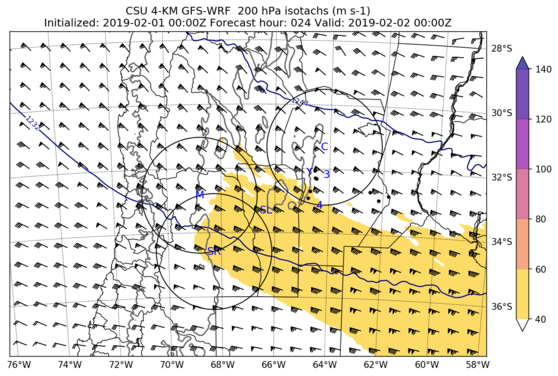
Total accumulated precipitation (zoom)Total accumulated precipitation (full domain)1-hourly precipitation (zoom) (click image for animation)1-hourly precipitation (full domain) (click image for animation)Simulated reflectivity (full domain) (click image for animation)Precipitable water (zoom) (click image for animation)Precipitable water (full domain) (click image for animation)Most-unstable CAPE and 0--6-km shear (zoom) (click image for animation)Most-unstable CAPE and 0--6-km shear (full domain) (click image for animation)LCL height and 0--1-km shear (zoom) (click image for animation)LCL height and 0--1-km shear (full domain) (click image for animation)Hourly maximum updraft helicity in 2--5-km layer (zoom) (click image for animation)Hourly maximum updraft helicity in 2--5-km layer (full domain) (click image for animation)Accumulated max updraft helicity in 2--5-km layer (zoom) (click image for animation)Accumulated max updraft helicity in 2--5-km layer (full domain) (click image for animation)500-hPa absolute vorticity, heights, and winds (full domain) (click image for animation)200-hPa isotachs, heights, and winds (full domain) (click image for animation)
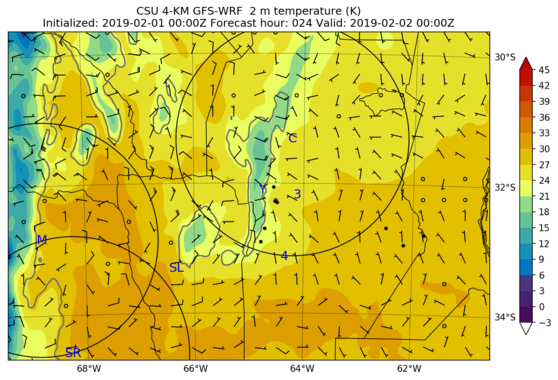
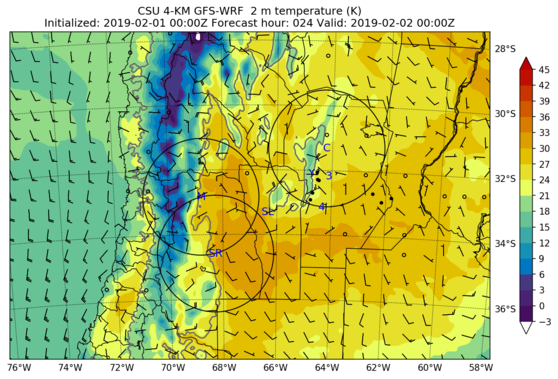
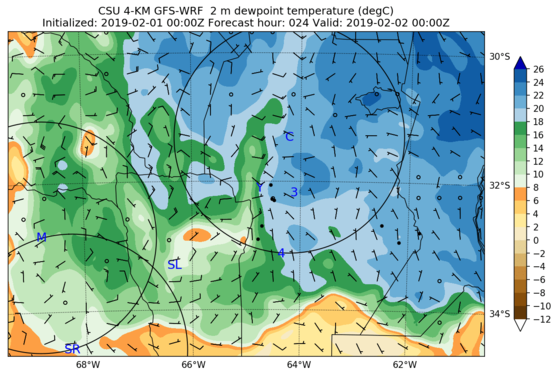
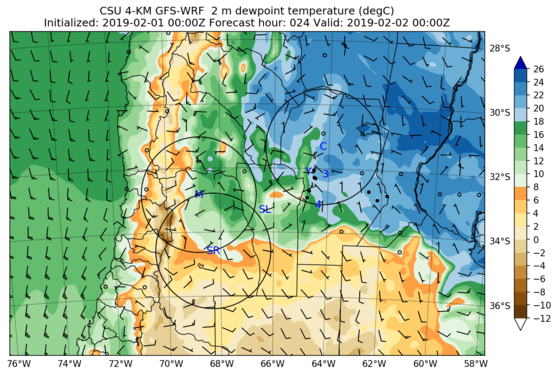
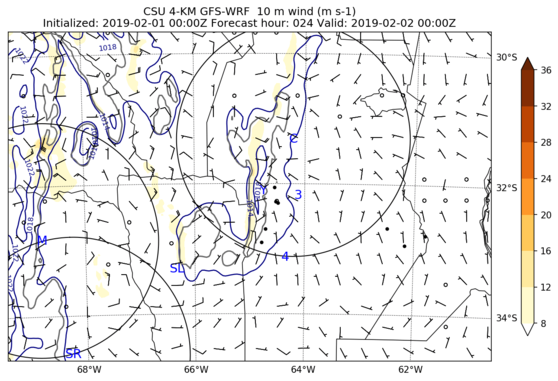
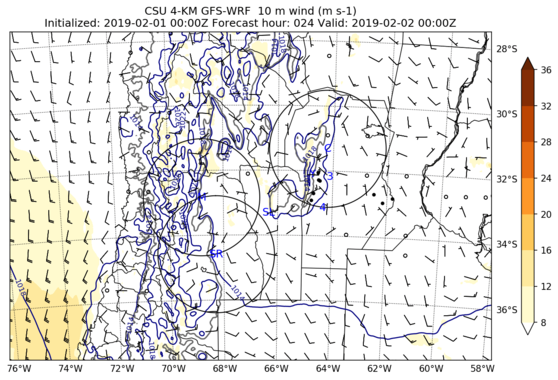
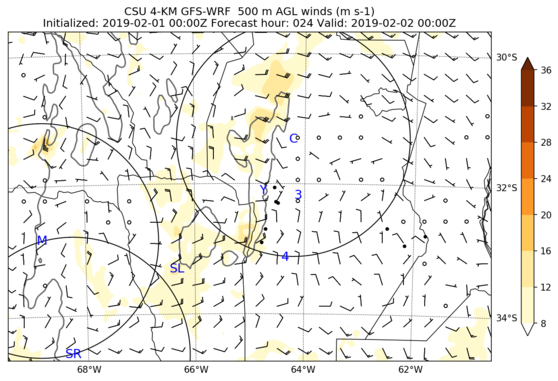
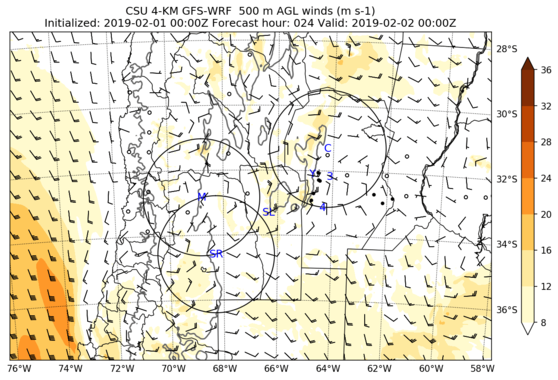
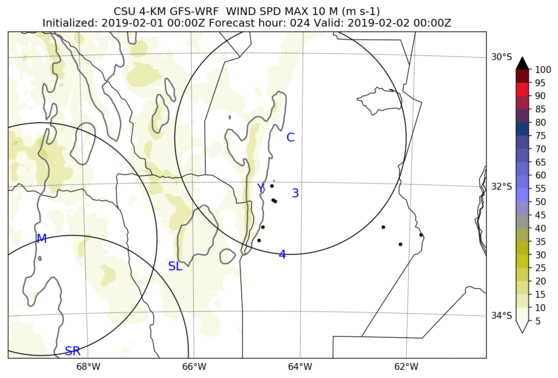
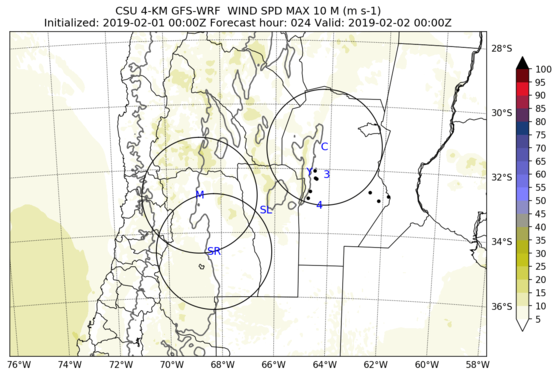
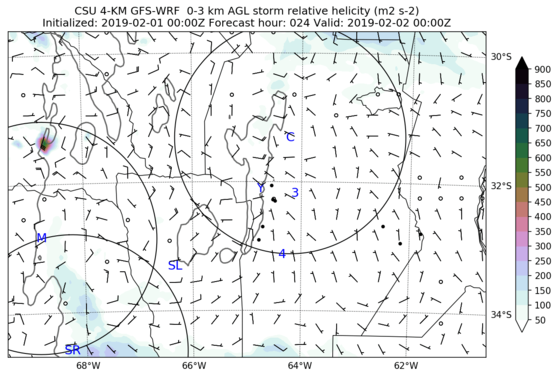
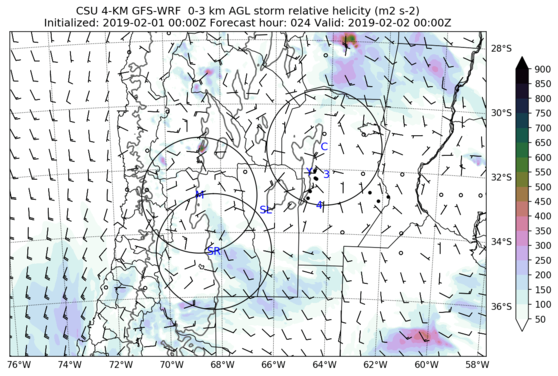
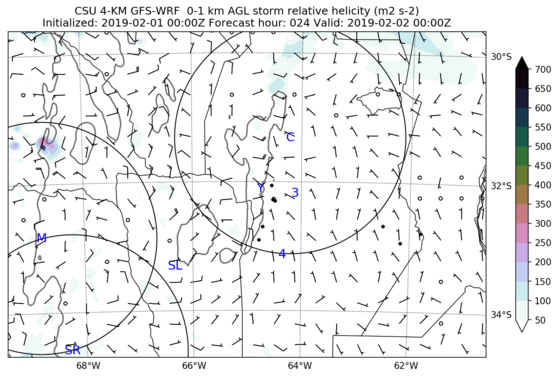
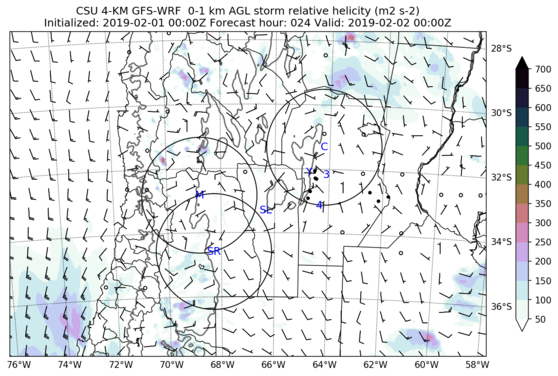
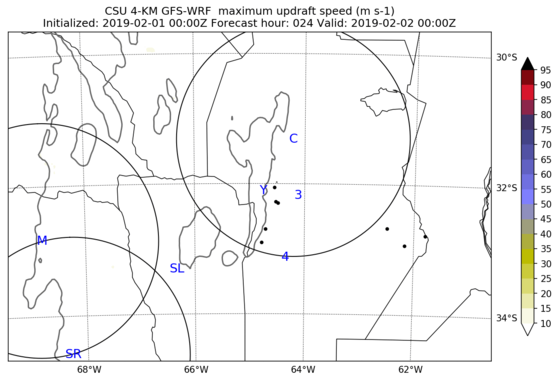
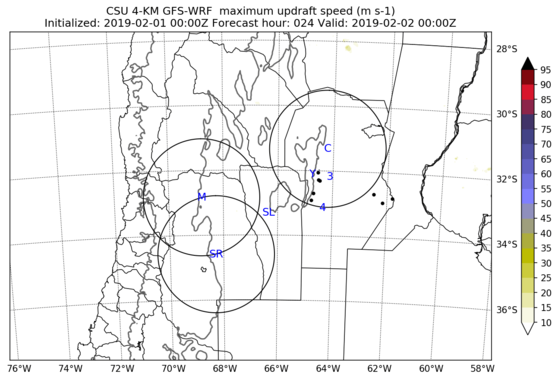
2-m temp, 10-m winds, MSLP (zoom) (click image for animation)2-m temp, 10-m winds, MSLP (full domain) (click image for animation)2-m dewpoint, 10-m winds, MSLP (zoom) (click image for animation)2-m dewpoint, 10-m winds, MSLP (full domain) (click image for animation)10-m wind speed and MSLP (zoom) (click image for animation)10-m wind speed and MSLP (full domain) (click image for animation)500-m AGL wind speed (zoom) (click image for animation)500-m AGL wind speed (full domain) (click image for animation)hourly max 10-m wind speed (zoom) (click image for animation)hourly max 10-m wind speed (full domain) (click image for animation)0-3-km SRH (zoom) (click image for animation)0-3-km SRH (full domain) (click image for animation)0-1-km SRH (zoom) (click image for animation)0-1-km SRH (full domain) (click image for animation)hourly column-maximum updraft (zoom) (click image for animation)hourly column-maximum updraft (full domain) (click image for animation)
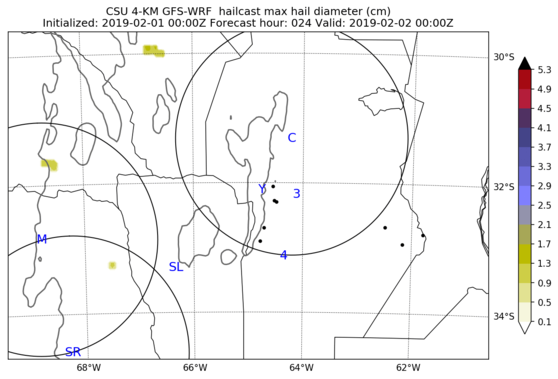
Hailcast maximum diameter (zoom) (click image for animation)Hailcast maximum diameter (full domain) (click image for animation)
Forecast hourly precipitation time series at Cordoba
Forecast accumulated precipitation time series at Cordoba
2-m temperature and dewpoint time series at Cordoba
10-m wind speed time series at Cordoba
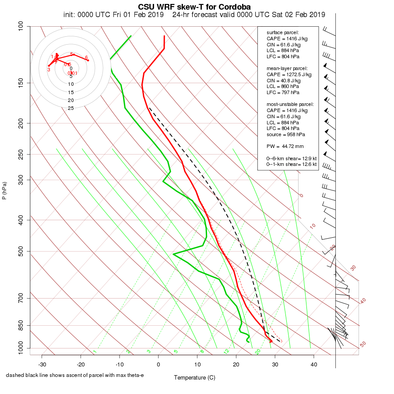
Forecast soundings (click on the image for a loop of forecast soundings at Cordoba, use the menu on the left to select different locations.)
DISCLAIMER: The images and data on this site are intended for meteorological education and research purposes and, although they should generally be up to date, are not monitored at all times.
Do not use for making decisions where money or lives are at stake. For official forecasts and warnings, visit the National Weather Service.
This material is based upon work supported by the National Science Foundation under Grant No. AGS-1157425. Any opinions, findings, and conclusions or recommendations expressed in this material are those of the author(s) and do not necessarily reflect the views of the National Science Foundation.