Verification of CSU WRF and NCEP model forecasts: precipitation, August 2012
Switch to current verification statistics
Note for August 2012: Because of the SREF upgrade on August 21 and the associated changes in file names, some SREF forecast files were lost near the end of the month. Because Hurricane Isaac occurred during this time period (and skill scores were accordingly high), the SREF mean scores are likely underestimated here.
NOTES:
-- Forecasts are verified against the NCEP Stage IV precipitation analysis
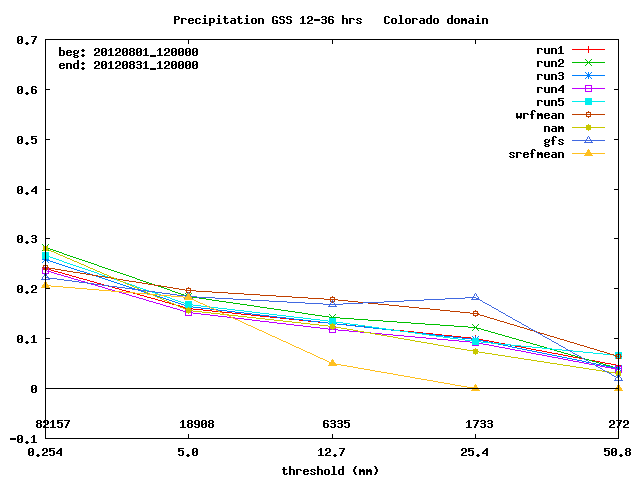
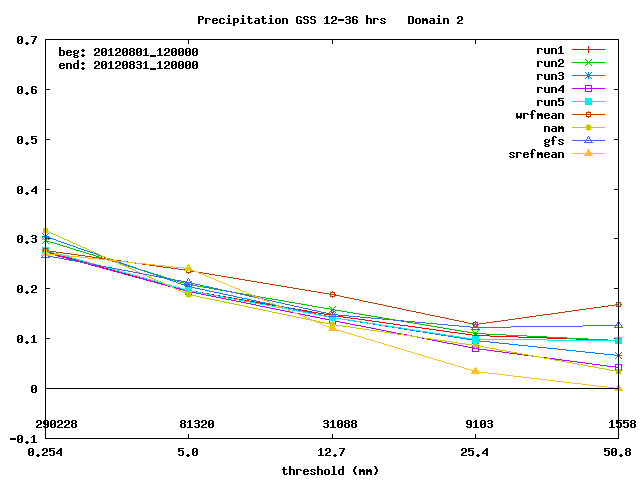
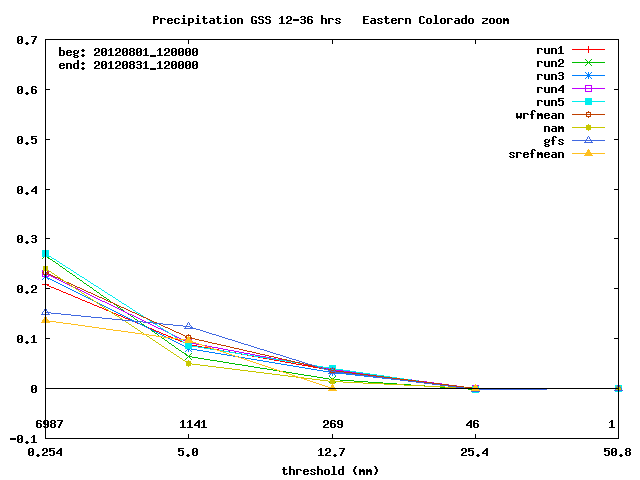
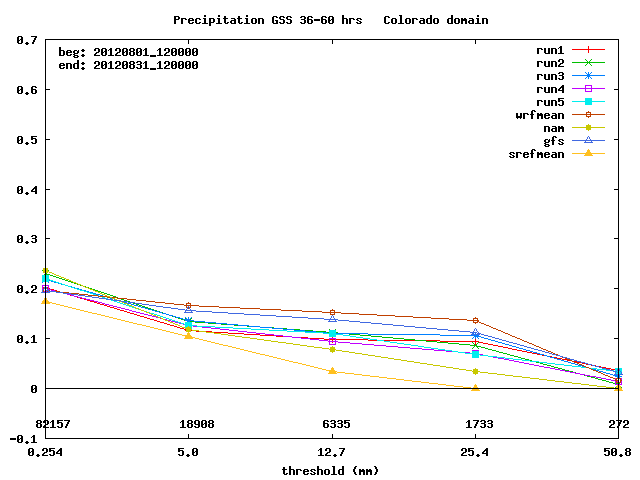
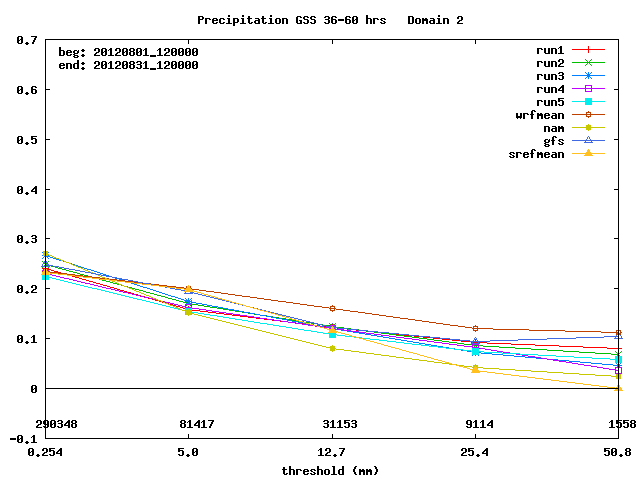
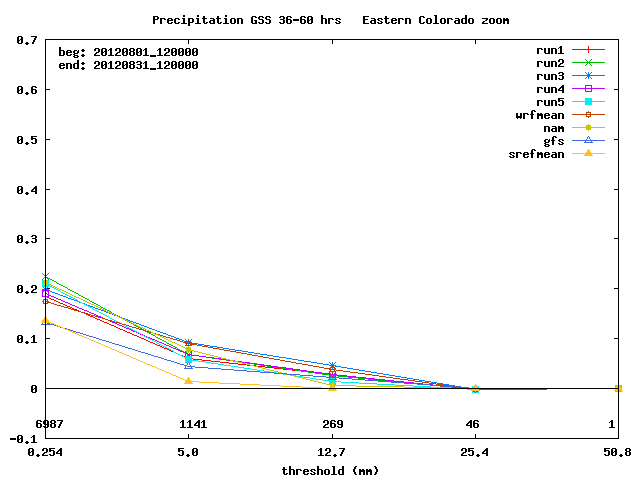
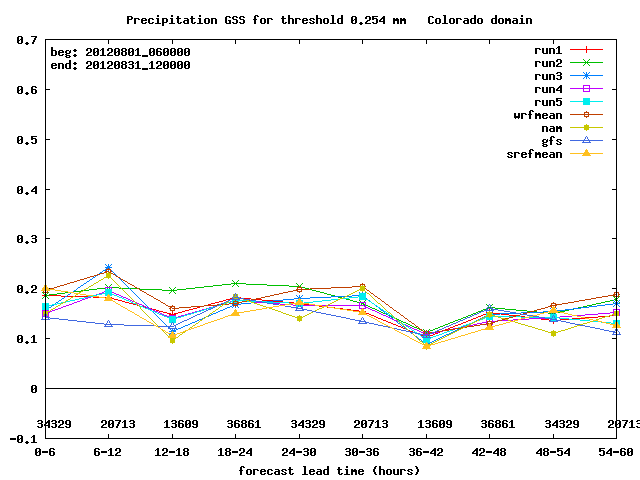
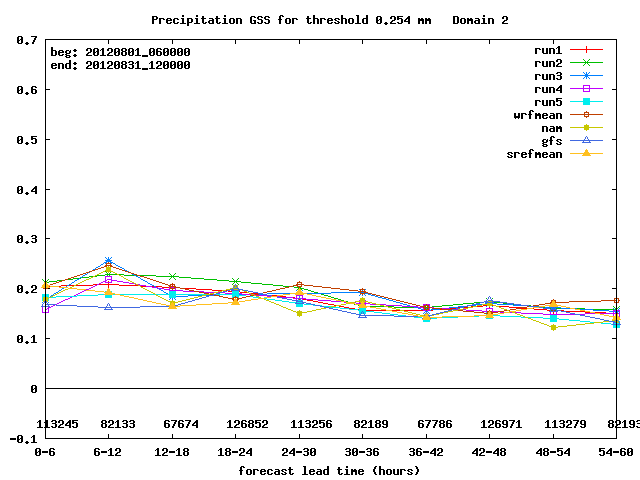
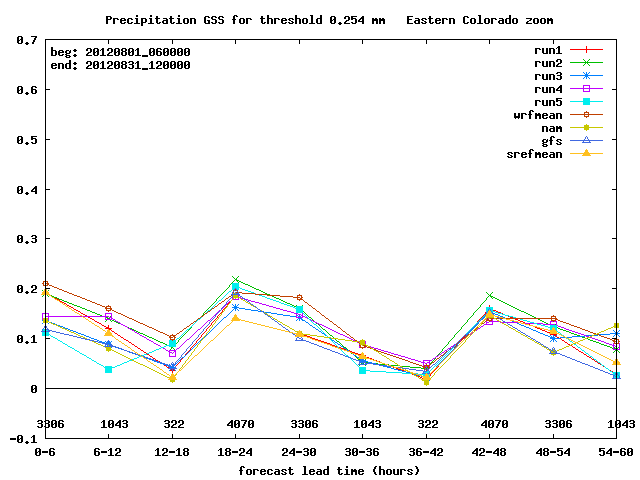
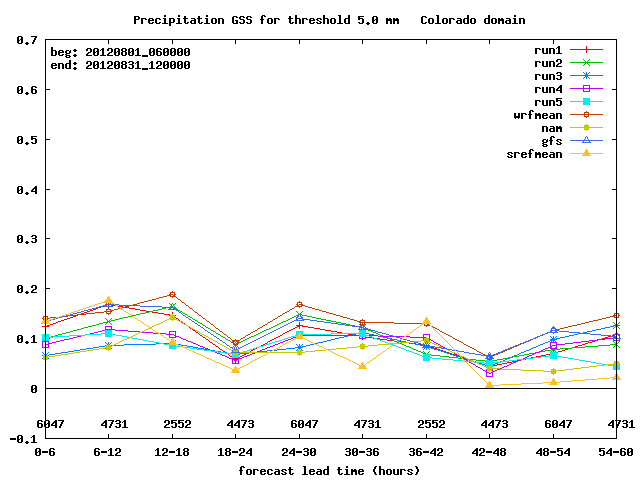
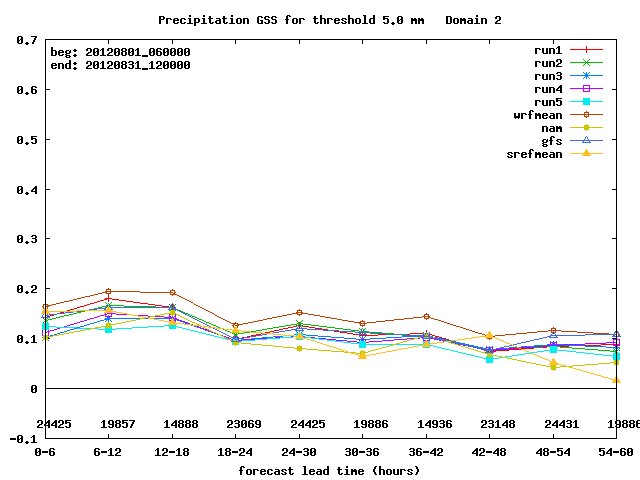
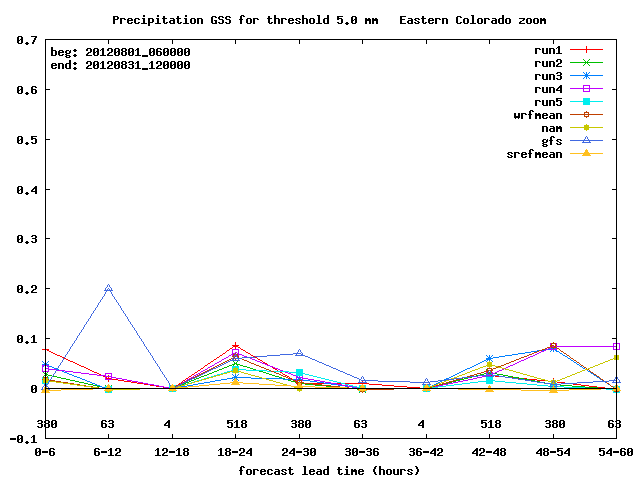
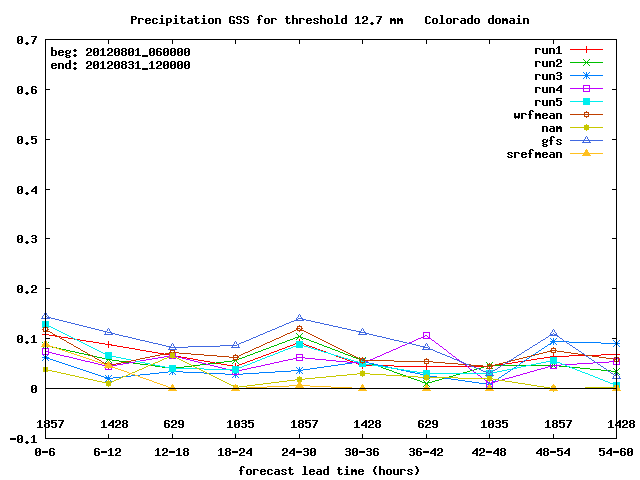
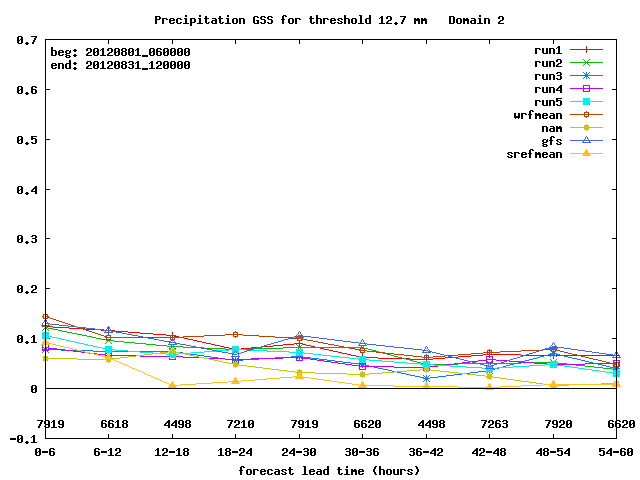
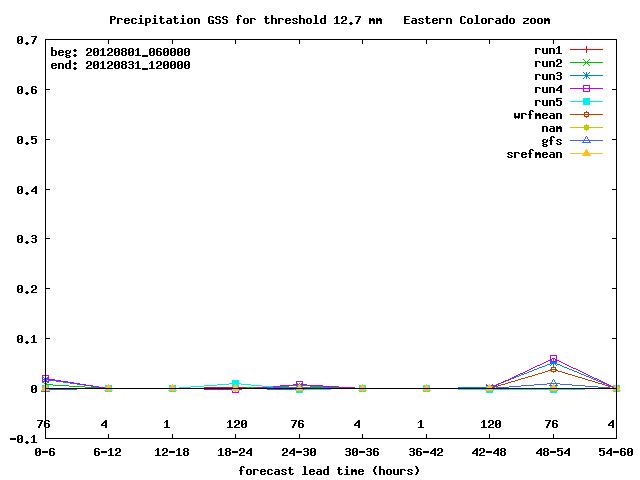
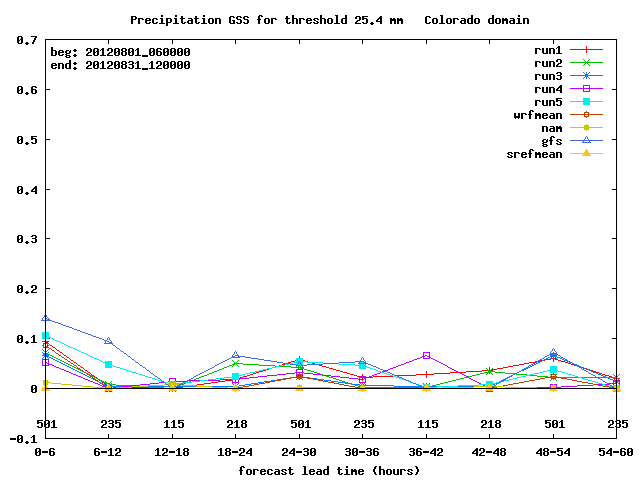
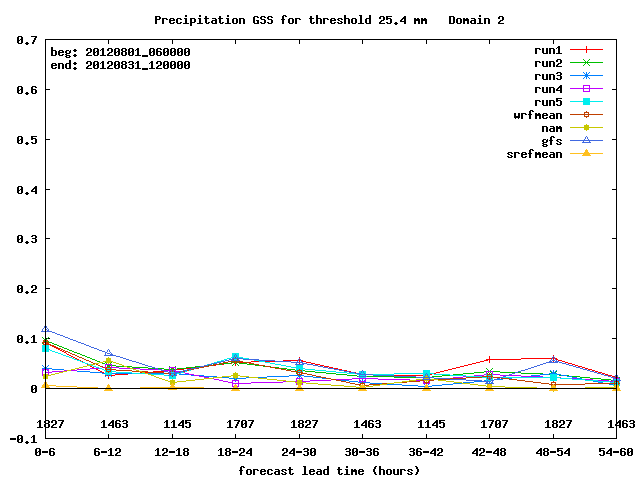
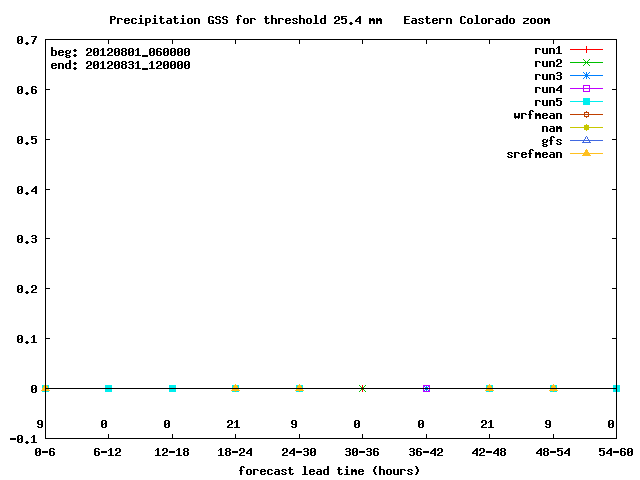
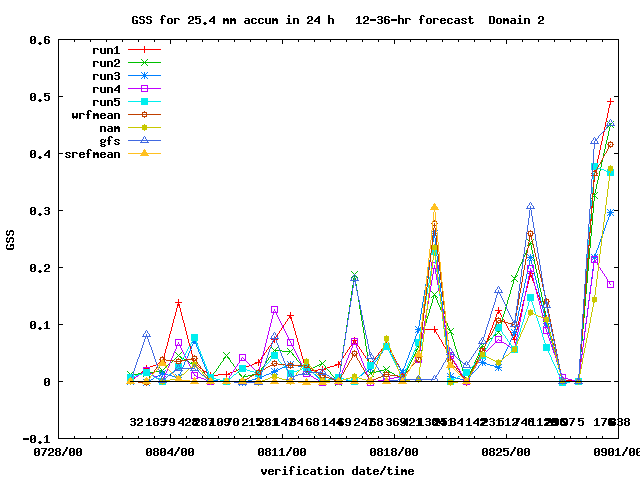
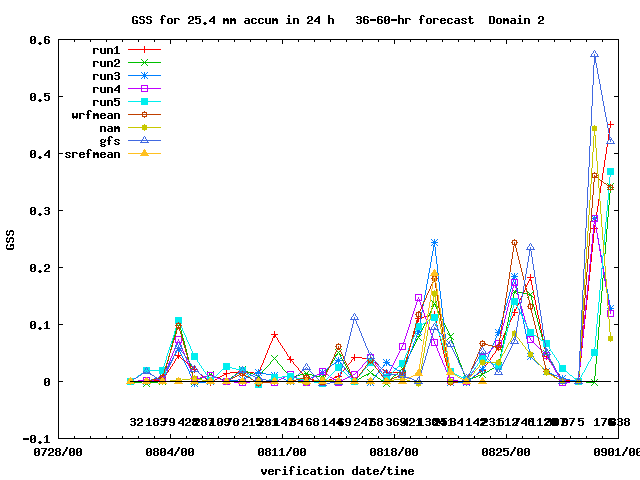
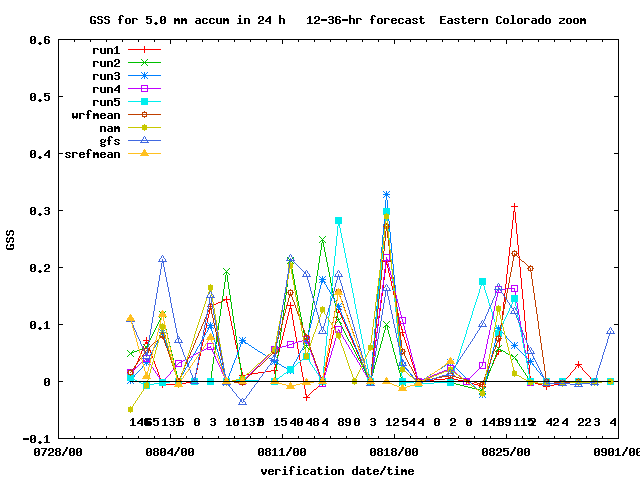
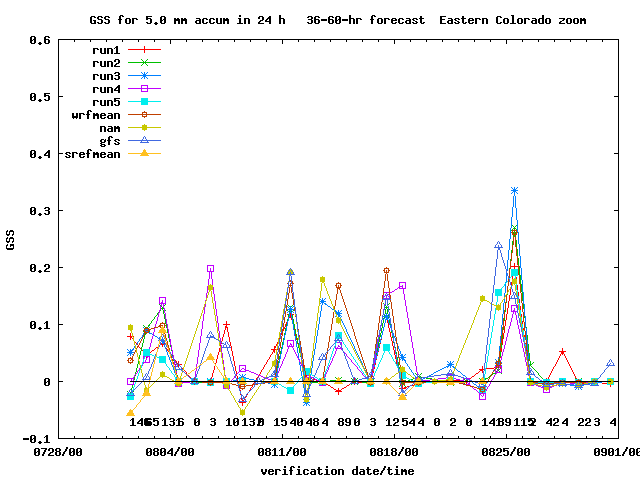
-- GSS = Gilbert Skill Score (also known as Equitable Threat Score), higher scores are better, 1 is perfect
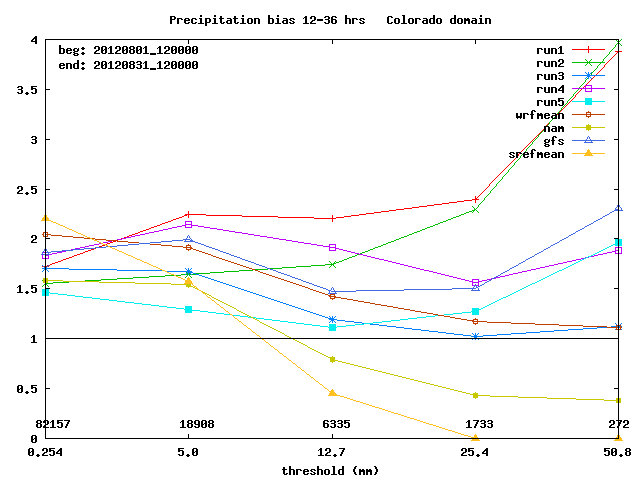
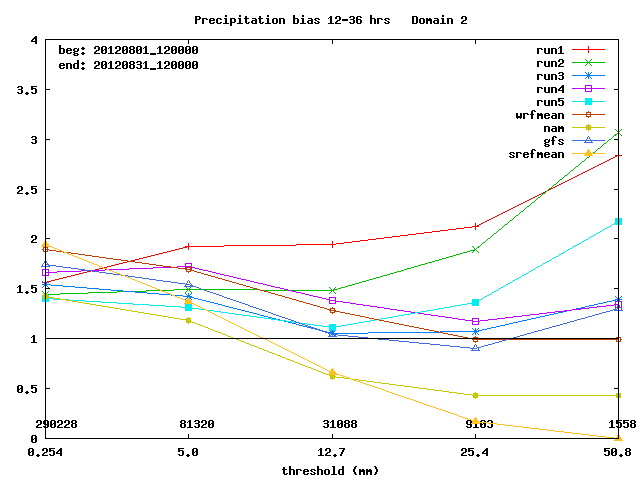
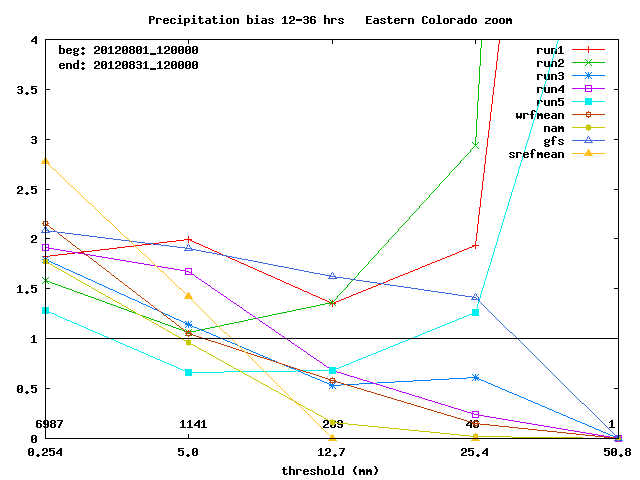
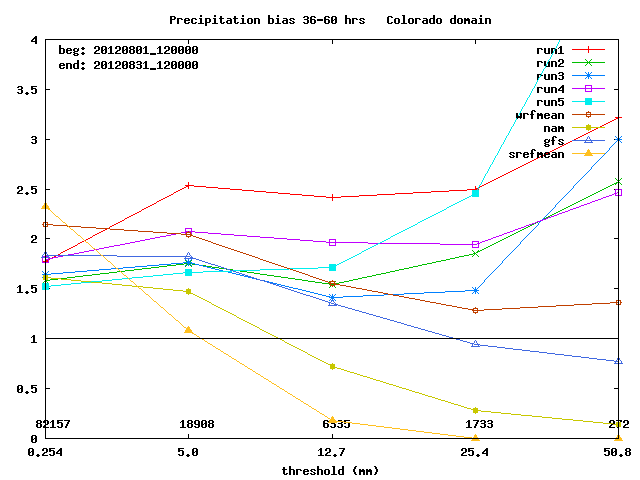
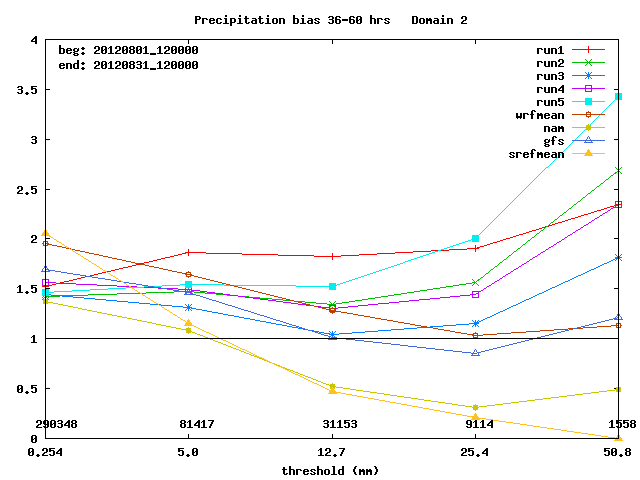
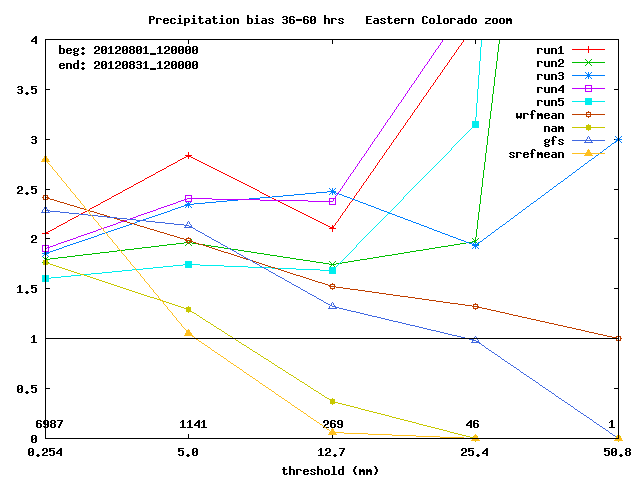
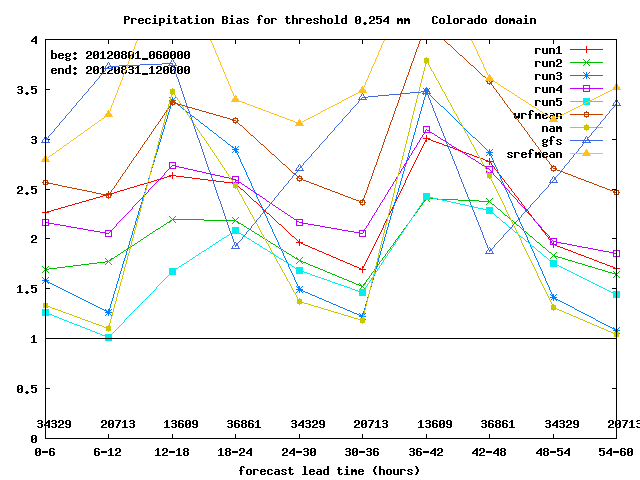
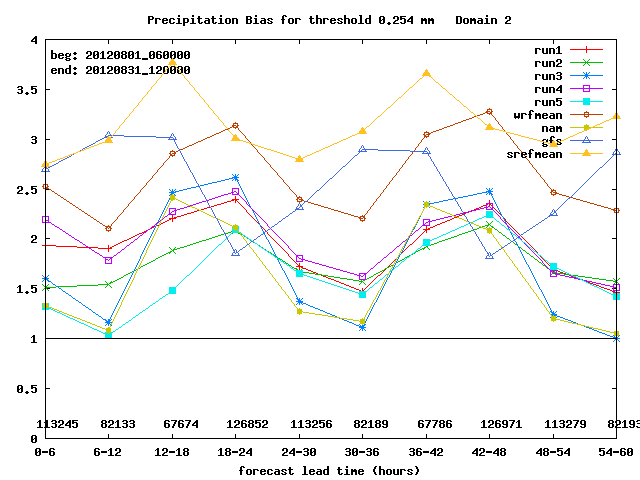
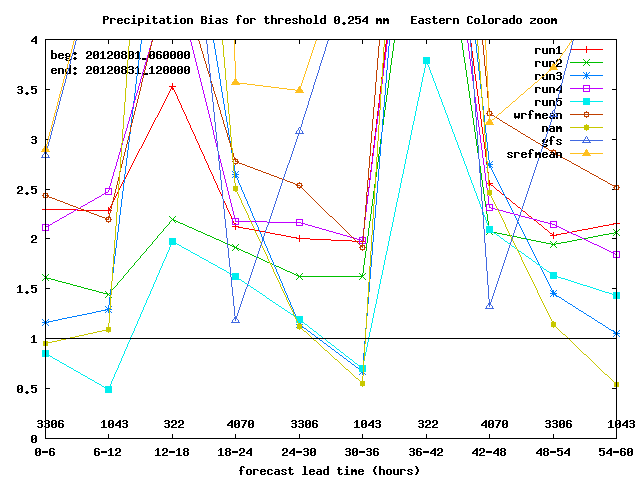
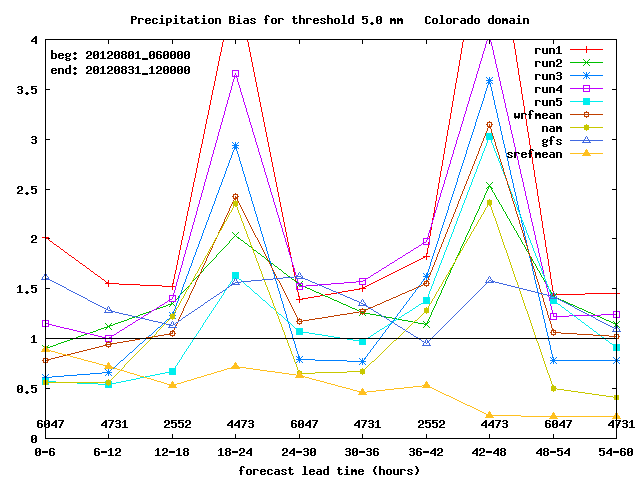
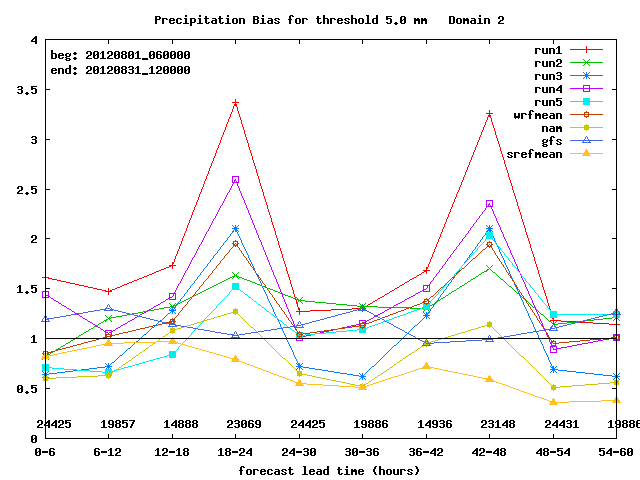
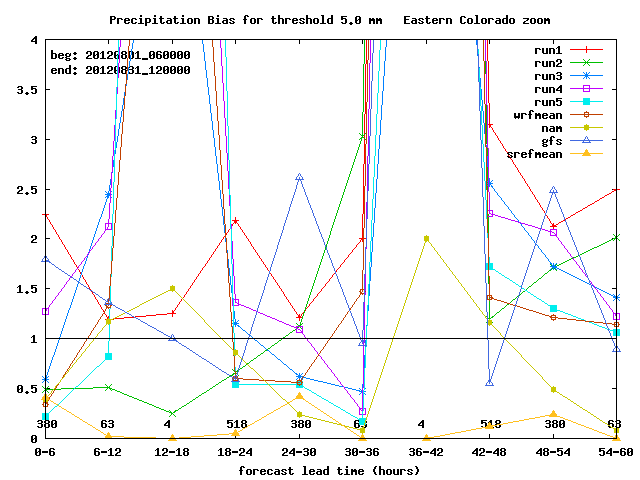
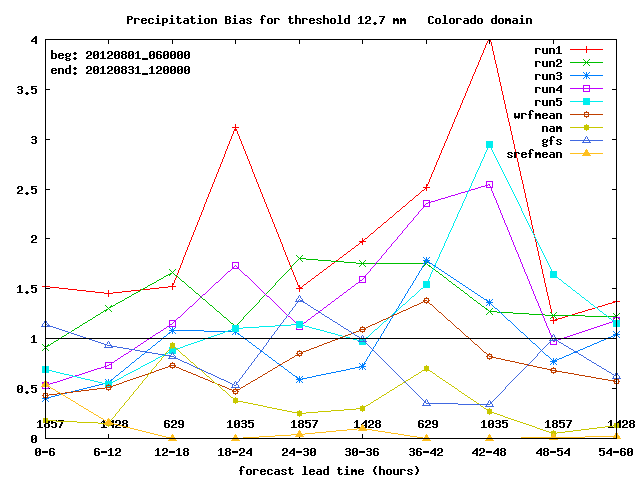
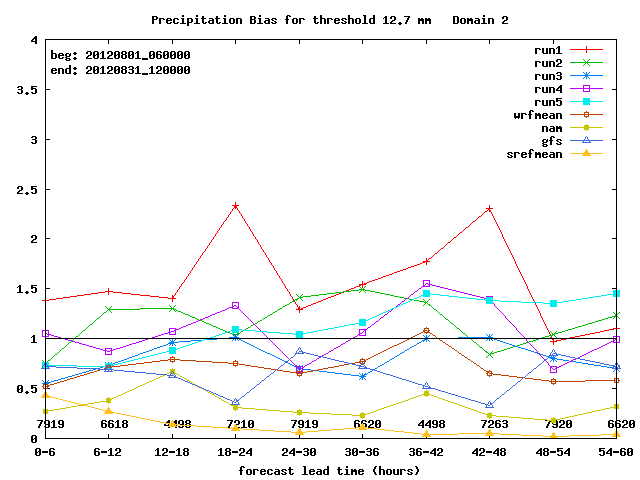
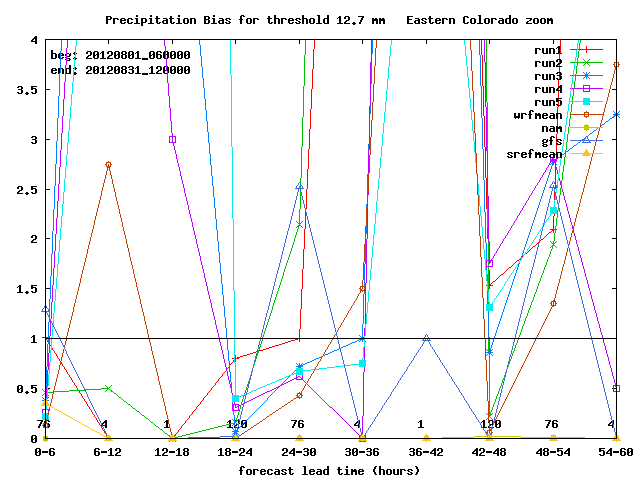
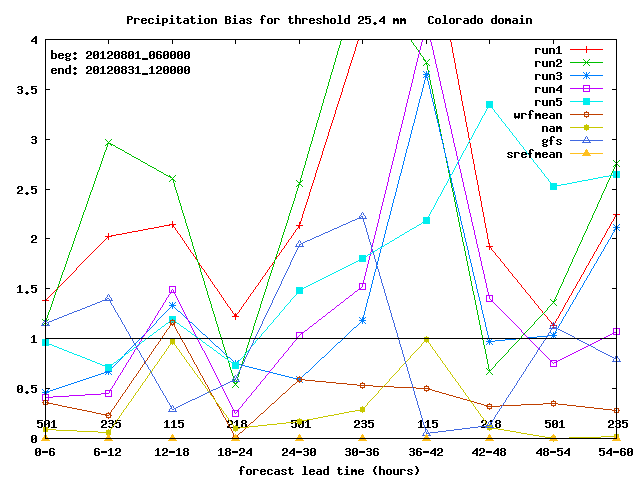
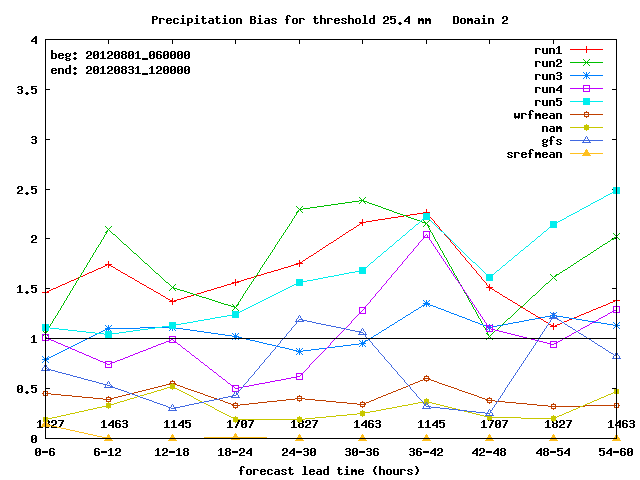
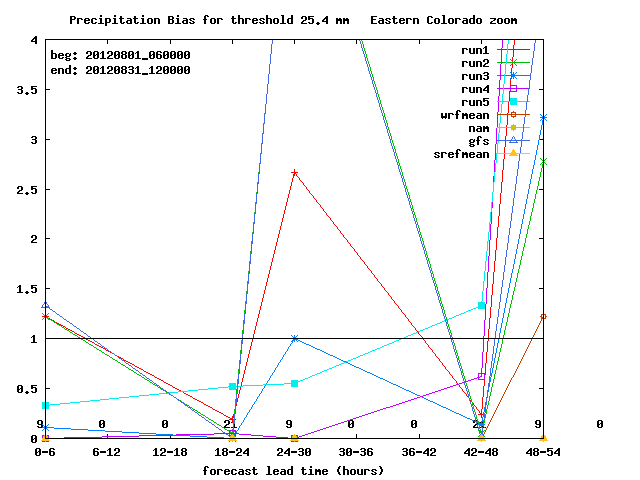
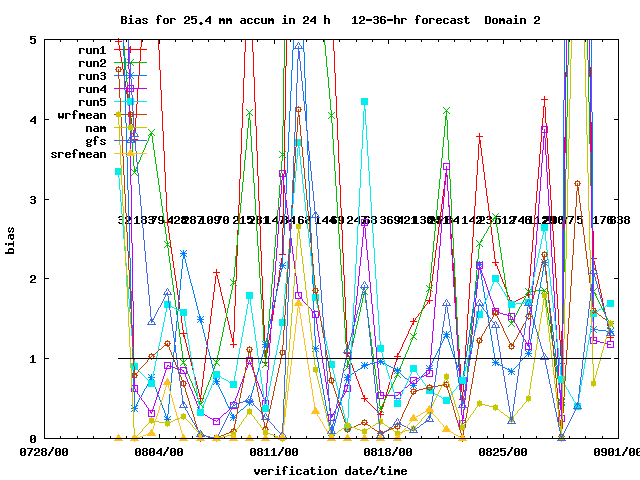
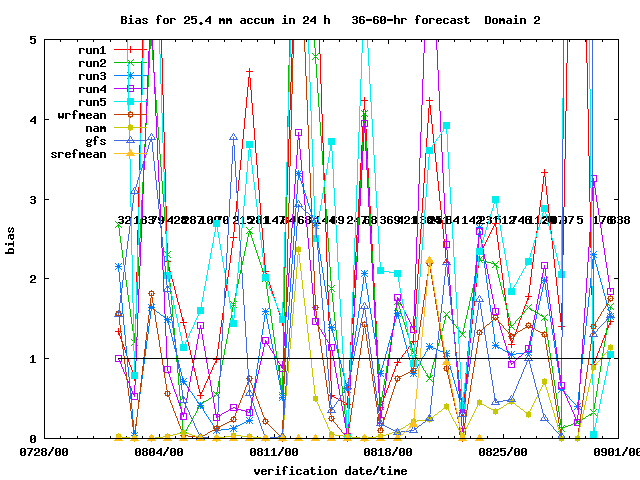
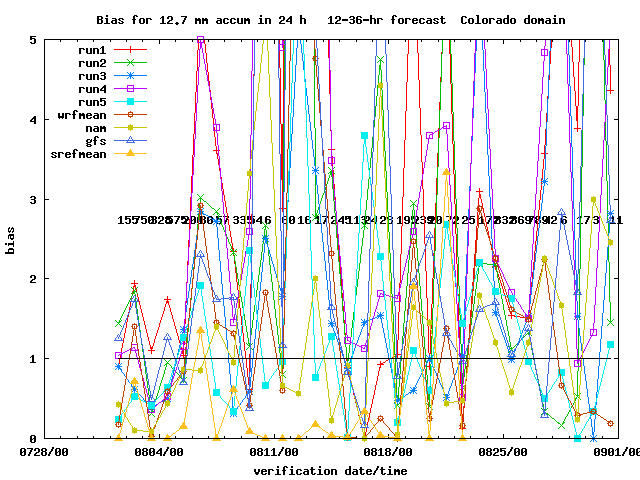
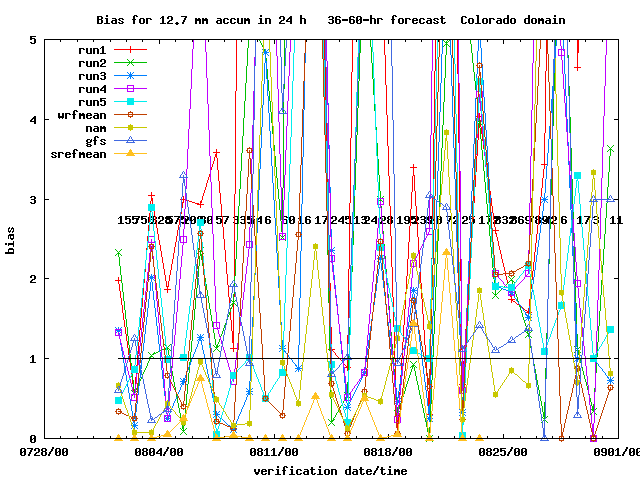
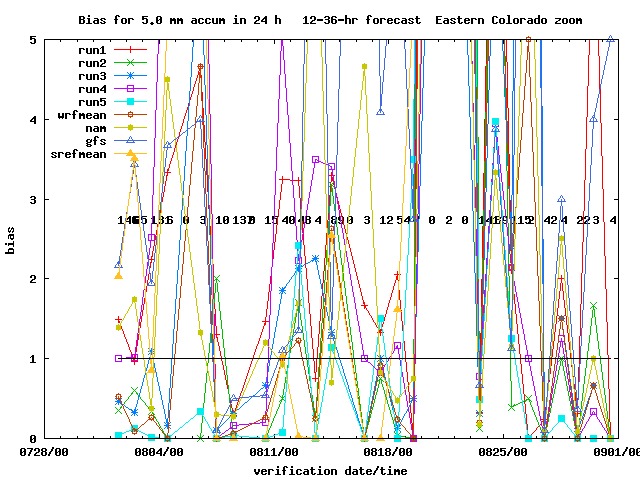
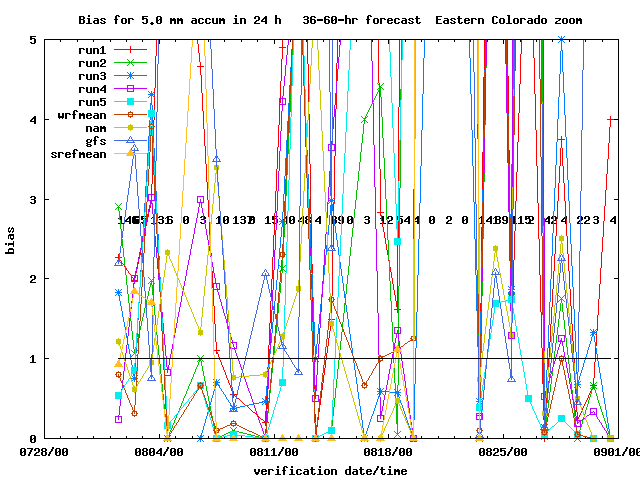
-- Bias = Frequency bias, the closer to 1 the better; values above 1 indicate the model predicts that amount of precip too frequently
-- Left two columns show statistics for a subdomain centered on Fort Collins, shown in these maps.
-- Right two columns show statistics for all of domain 2 (12-km grid spacing), which is the inner grid shown here. It covers much of the western and central US.
-- The "Eastern Colorado zoom" domain is a model subdomain covering only eastern Colorado and parts of eastern Wyoming and western Nebraska, shown here.
-- The top four rows show GSS and bias for 24-h precipitation forecasts versus accumulation threshold.
-- The next set of rows show GSS and bias for 6-h precip forecasts versus lead time at different accumulation thresholds.
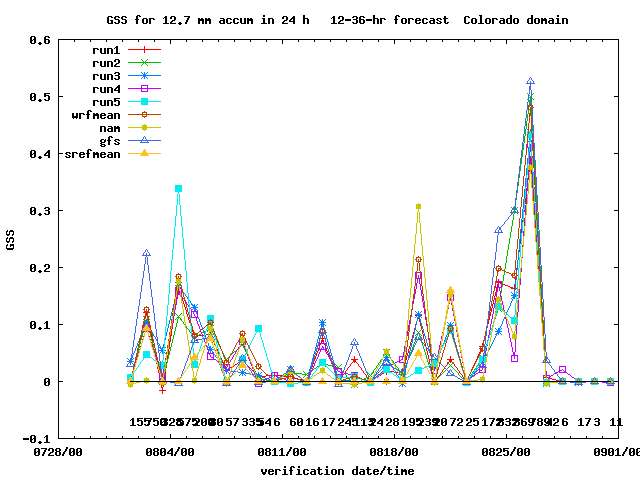
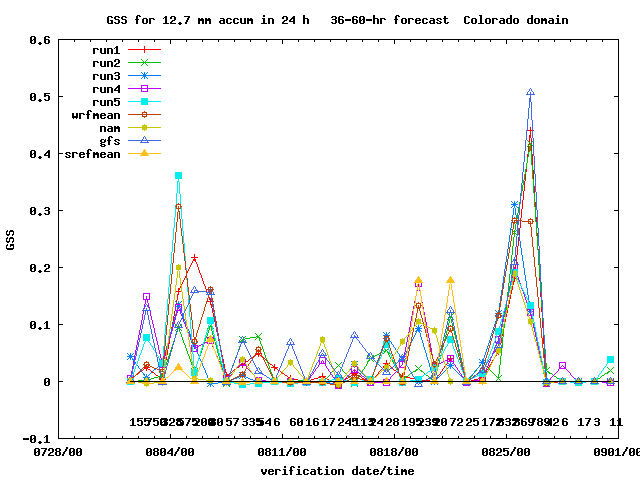
-- At the very bottom are time series of GSS and bias for the 24-h accumulation, showing how the forecasts performed from day to day.
-- Scores are calculated using the Meteorological Evaluation Tools software package.
12--36-hour precipitation forecast
36--60-hour precipitation forecast
Time series: 0.254 mm (0.01 inch) in 6 hr
Time series: 5.0 mm (0.2 inch) in 6 hr
Time series: 12.7 mm (0.5 inch) in 6 hr
Time series: 25.4 mm (1.0 inch) in 6 hr
Time series: GSS and bias vs. date for 25.4 mm in 24 hours (full domain 2)
Time series: GSS and bias vs. date for 12.7 mm in 24 hours (Colorado domain)
Time series: GSS and bias vs. date for 5.0 mm in 24 hours (eastern Colorado zoom)

