Colorado State University
Real-Time Weather Data
Precip. Sys. Research Group
Colorado State University
Real-Time Weather Data
Precip. Sys. Research Group
Colorado State University
Real-Time Weather Data
Precipitation Systems Research Group
Skip navigation
  • Home
  • CSU WRF Forecasts
    • 12-km Ensemble: CO
    • 12-km Forecast Soundings
    • 4-km Forecast
    • 4-km Forecast: WxC Zoom
    • 4-km Forecast Soundings
    • 12-km Model Information
    • 4-km Model Information
  • CSU Machine Learning Forecasts
    • CSU-MLP (precip)
    • CSU-MLP (severe weather)
    • downslope windstorms
  • Model Forecasts
    • GFS
    • NAM
    • GEFS
    • NAM 3-km Nest
    • HRRR
    • ECMWF
    • AIWeather
  • Heavy Precip
    • ARI Monitoring
    • TORFF Identification
  • Links
    • Fort Collins Weather Station
    • Christman Field Wx Station
    • CoAgMET
    • NWS Denver/Boulder
    • NWS Cheyenne
    • CIRA SLIDER satellite imagery
    • Fort Collins Rain Gauges

ERA5 images from Fort Collins 12" snowstorms, 1979-2022

The links below each indicate a 12" snowstorm, defined as one or more consecutive days of measurable snowfall, at the Fort Collins weather station since 1979. In each directory are some basic maps from the ERA5 (ECMWF reanalysis) for these cases. The maps begin 4 days prior to the start of the snowstorm, and continue for four days after that, with maps at 0000 and 1200 UTC. Select a case and check it out!

Listing of cases (in YYYYMMDD format, with the date shown here being the start of the event)

    19791120197912271980032619830403198512081988033019890201199002131990030619920308199710242003031820061220200910282013041520130501201601302016032320191125202004162020102520210313

This event started on 19880330 and had a storm total snowfall of 49.53 cm, or 19.50 inches!

Select a level/field

    Dynamic tropopause250 mb500 mb700 mb850 mbMSLP/thicknessMSLP/precipprecipitable waterQ-vectors

Click or hover mouse over a date to see the map (dates are listed as YYMMDD_HH, so that 791116_00 indicates 0000 UTC 16 November 1979). Left arrow for previous frame, right arrow for next, space to pause/play; click to open image in new tab
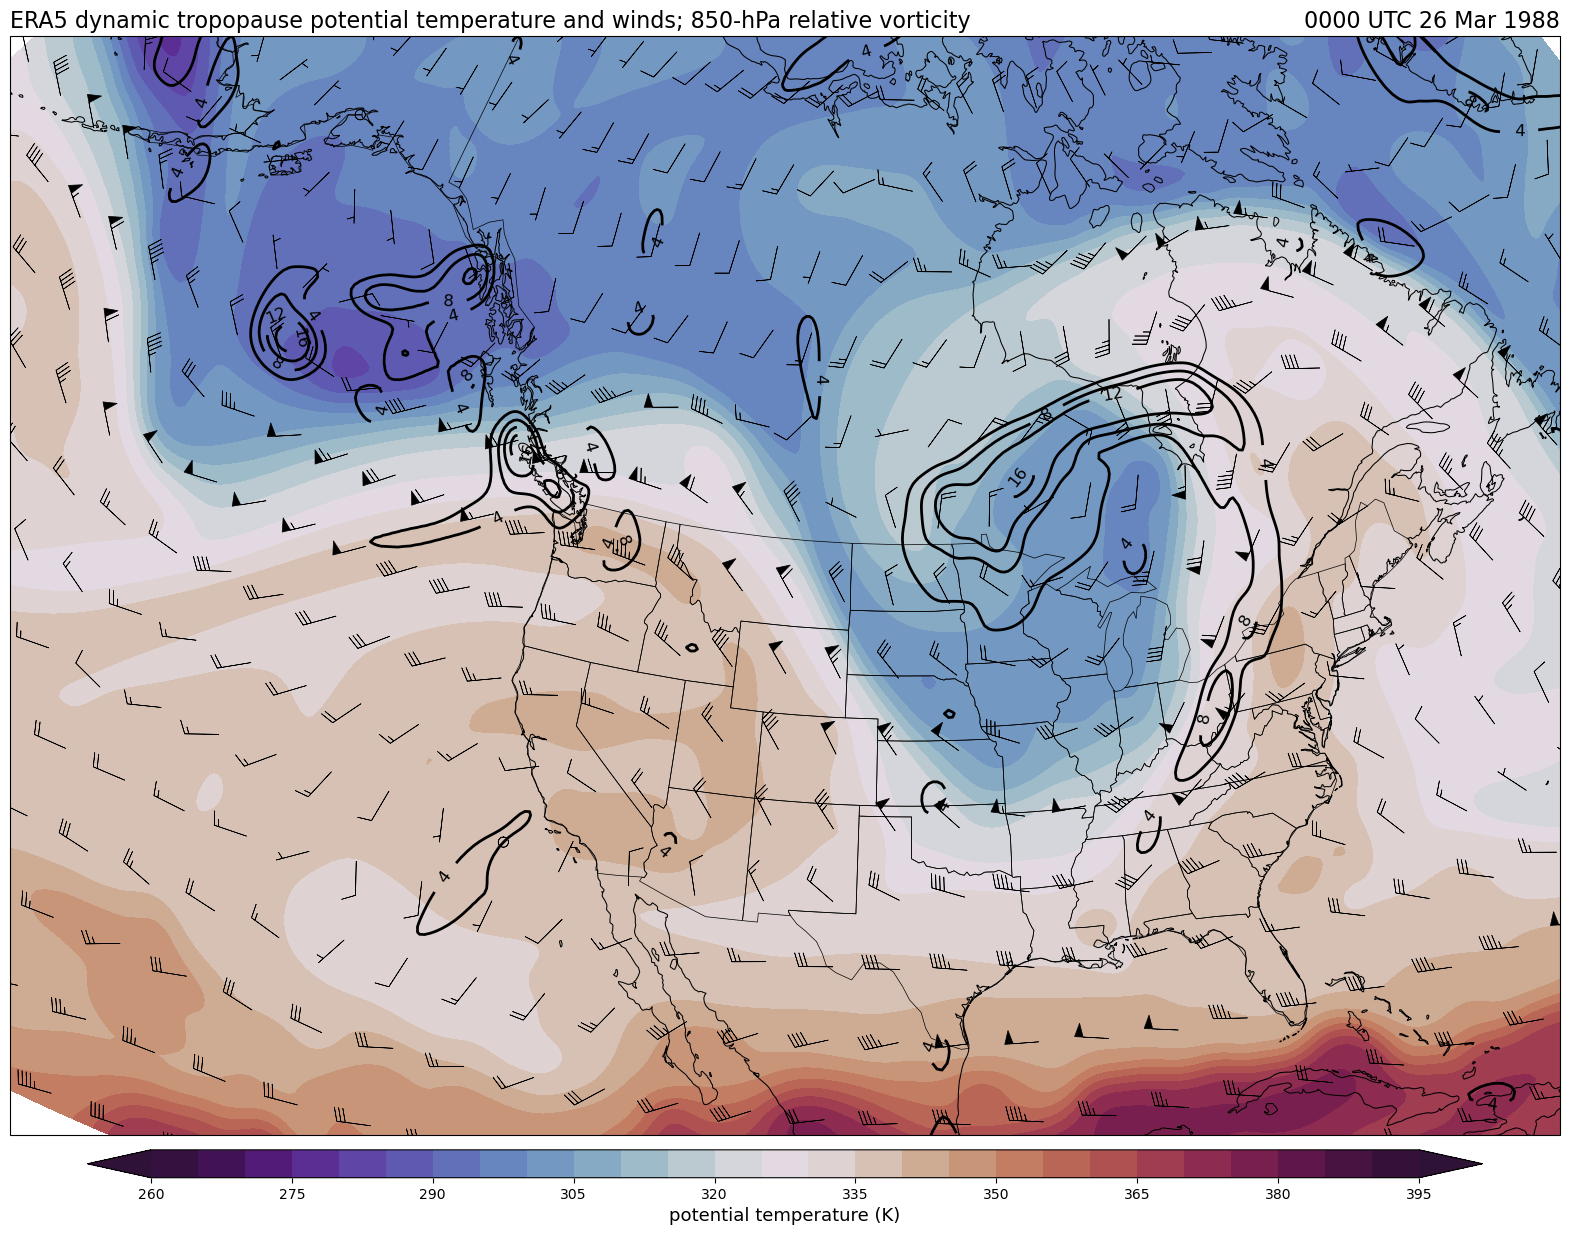
   
880326_00 880326_06 880326_12 880326_18 880327_00 880327_06 880327_12 880327_18 880328_00 880328_06 880328_12 880328_18 880329_00 880329_06 880329_12 880329_18 880330_00 880330_06 880330_12 880330_18 880331_00 880331_06 880331_12 880331_18 880401_00 880401_06 880401_12 880401_18 880402_00 880402_06 880402_12 880402_18 880403_00 880403_06 880403_12 880403_18

Do you want to make plots like these for your own cases of interest? Check out the code on Github.

Data obtained from the ECWMF Climate Data Store and plotted using tools from the Unidata Python training gallery.


DISCLAIMER: The images and data on this site are intended for meteorological education and research purposes and, although they should generally be up to date, are not monitored at all times. Do not use for making decisions where money or lives are at stake. For official forecasts and warnings, visit the National Weather Service.

Walter Scott, Jr.
College of Engineering
Research Group Home People Research Teaching Resources Contact
Precip. Systems Research Group
GIVE
Contact CSU Equal Opportunity Privacy Statement Disclaimer

© 2026 Colorado State University, Fort Collins, Colorado 80523 USA

© 2026 Colorado State University,
Fort Collins, Colorado 80523 USA

Colorado State University logo