Verification of CSU WRF and NCEP model forecasts: precipitation, Apr 2013
Switch to current verification statistics
NOTES:
-- Forecasts are verified against the NCEP Stage IV precipitation analysis
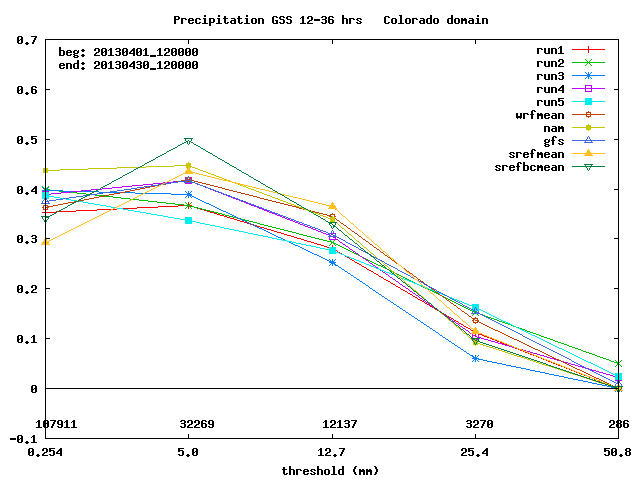
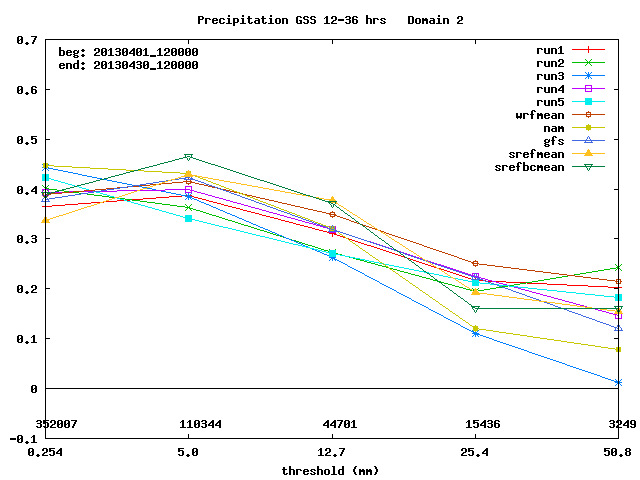
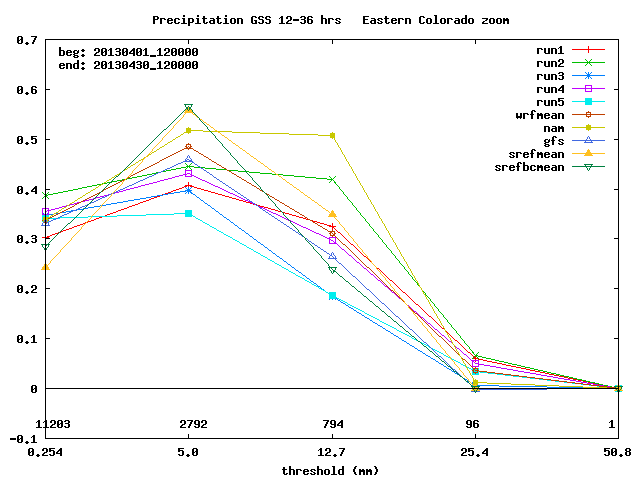
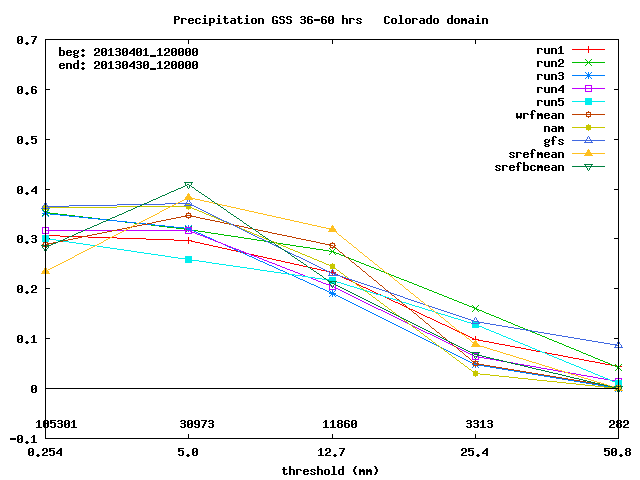
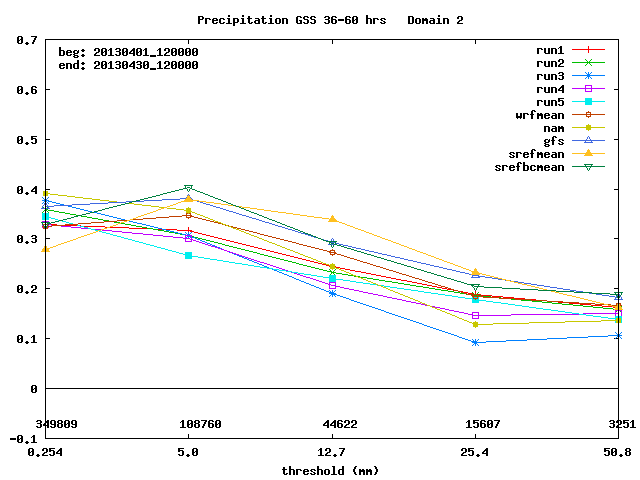
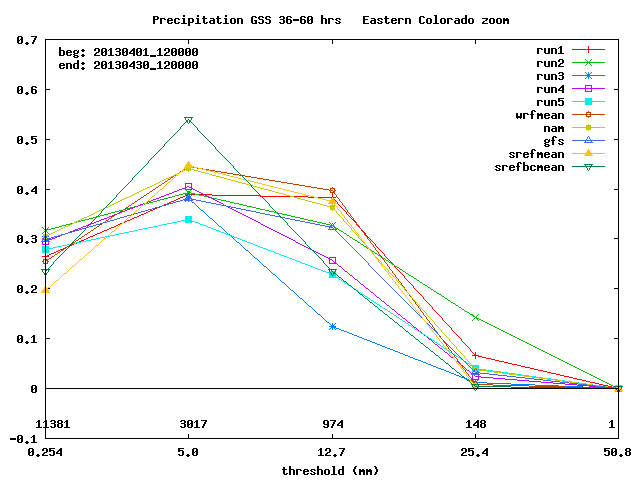
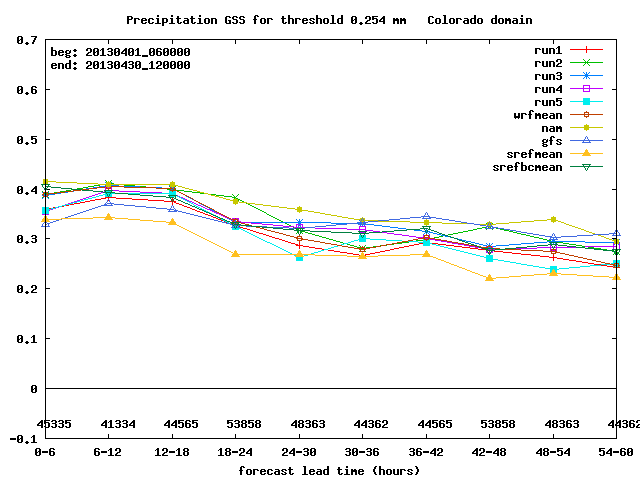
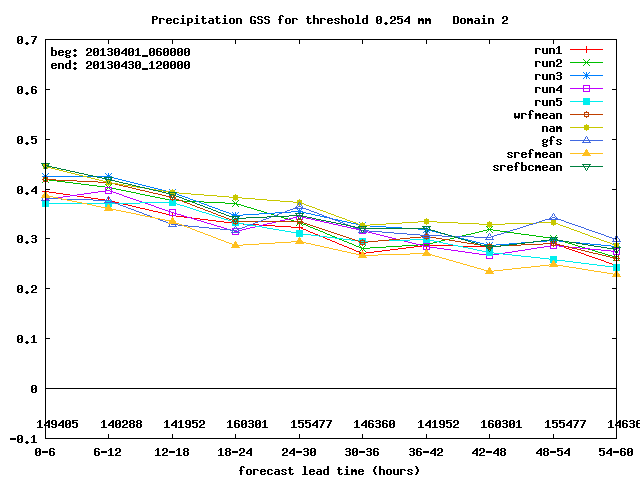
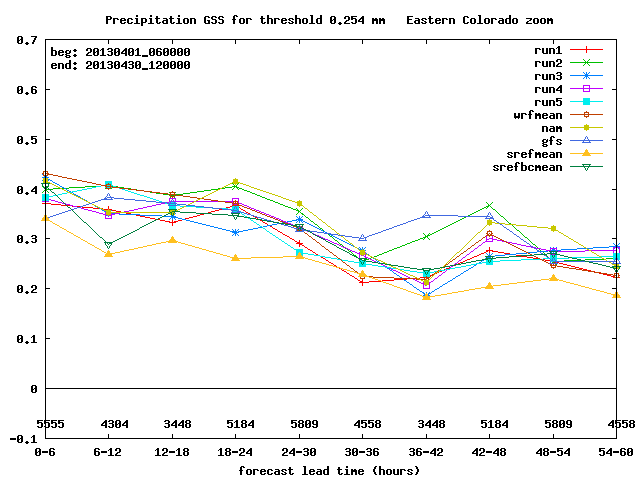
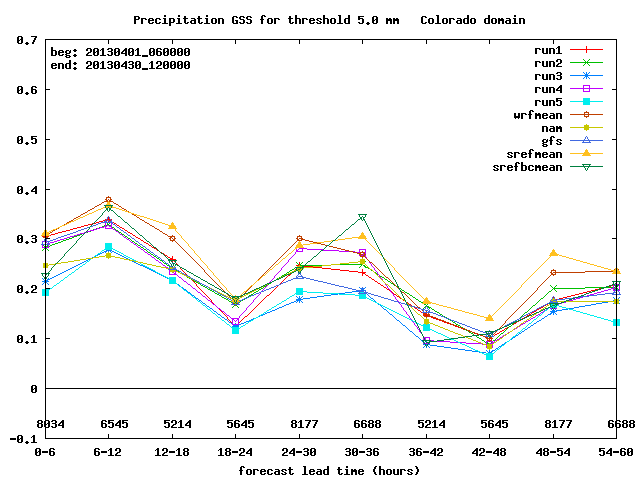
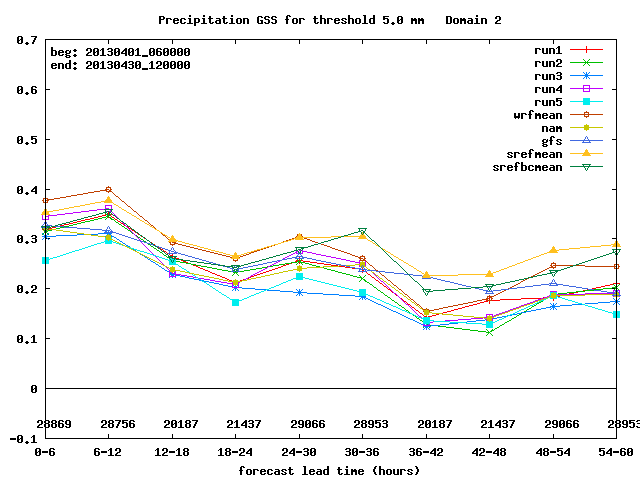
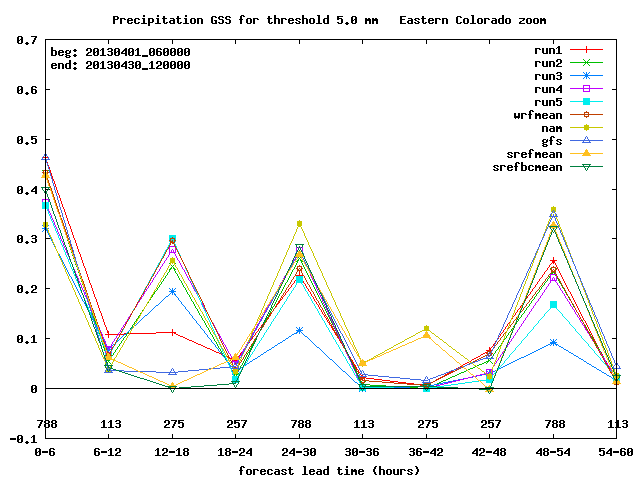
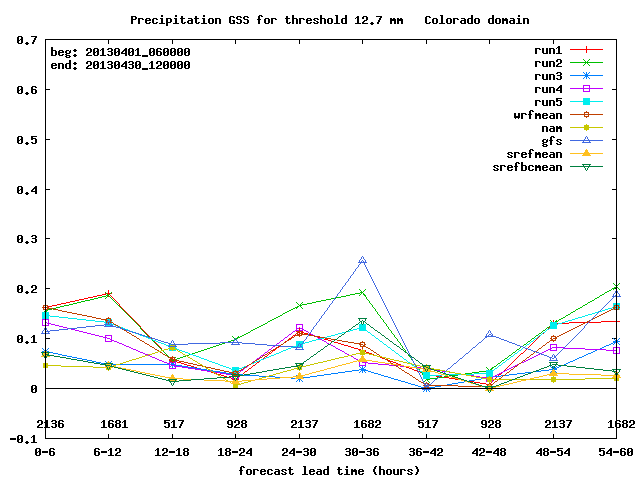
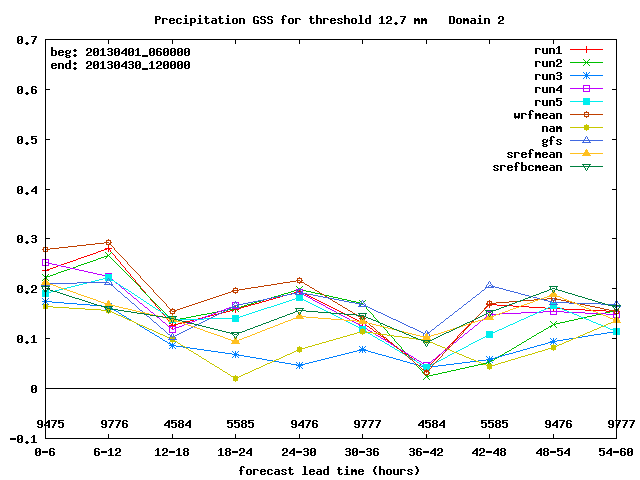
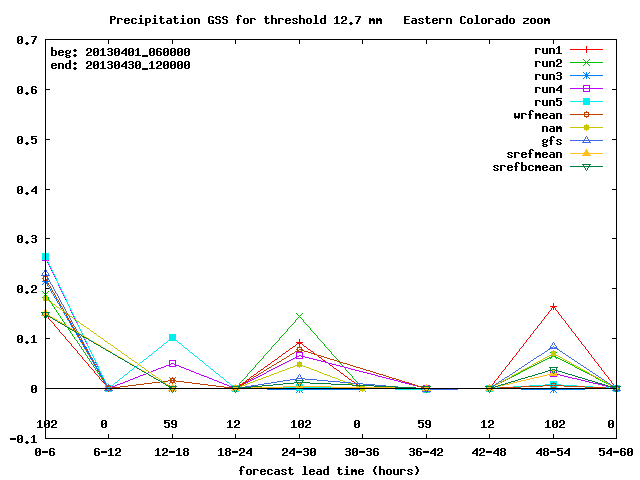
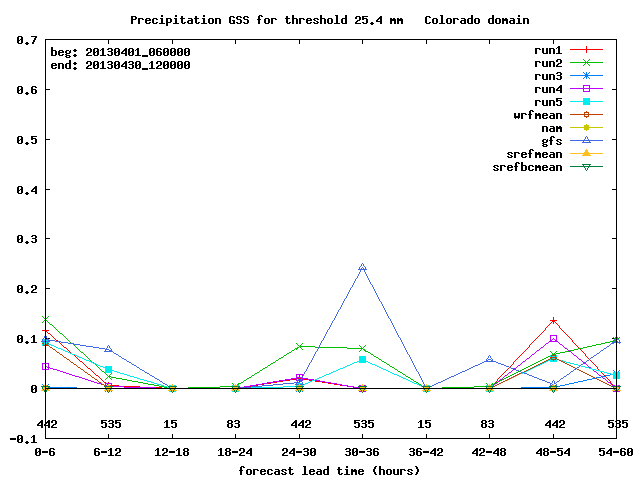
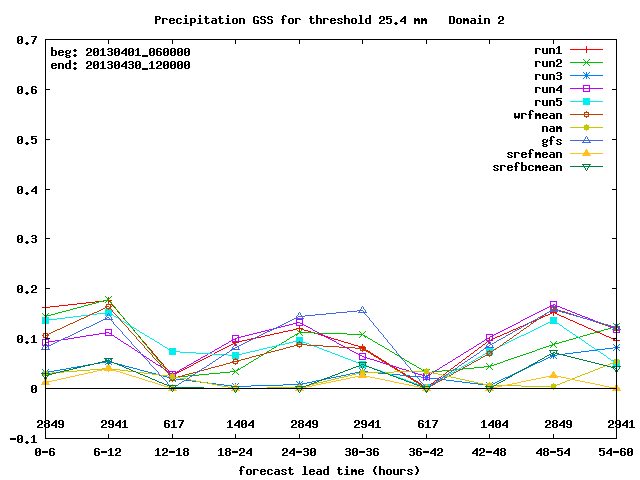
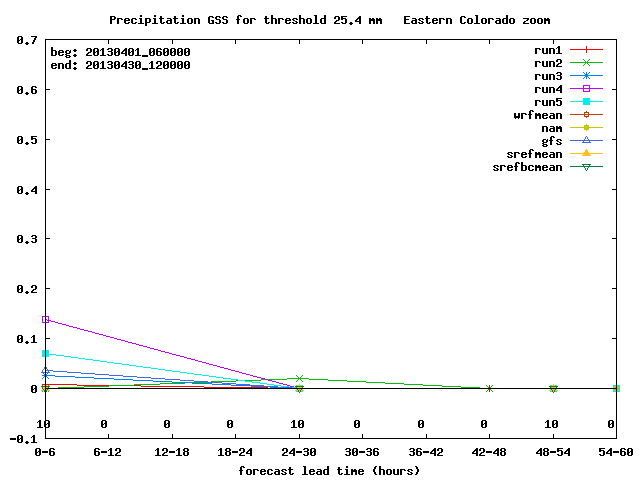
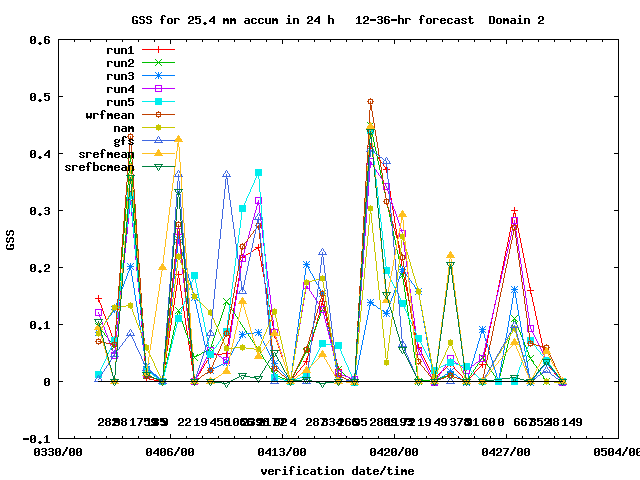
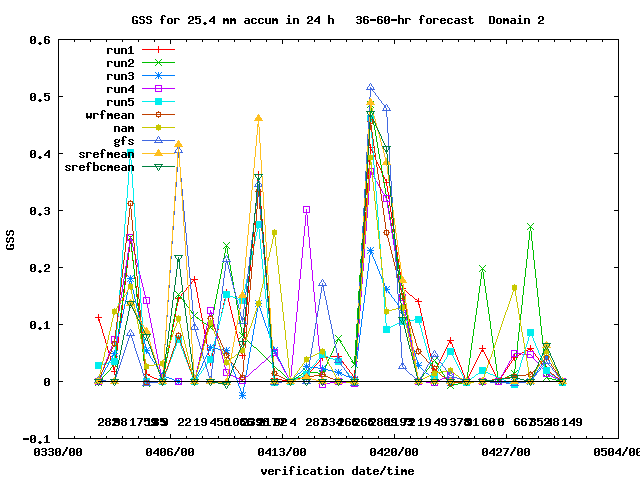
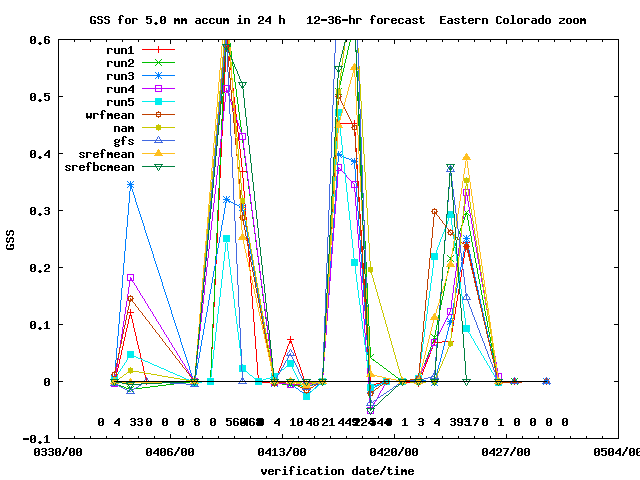
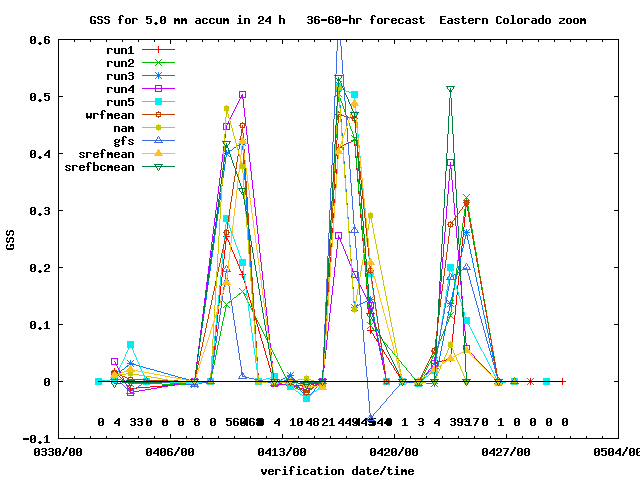
-- GSS = Gilbert Skill Score (also known as Equitable Threat Score), higher scores are better, 1 is perfect
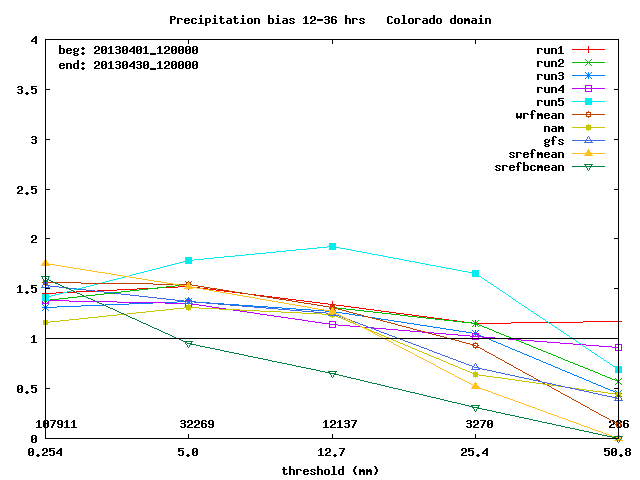
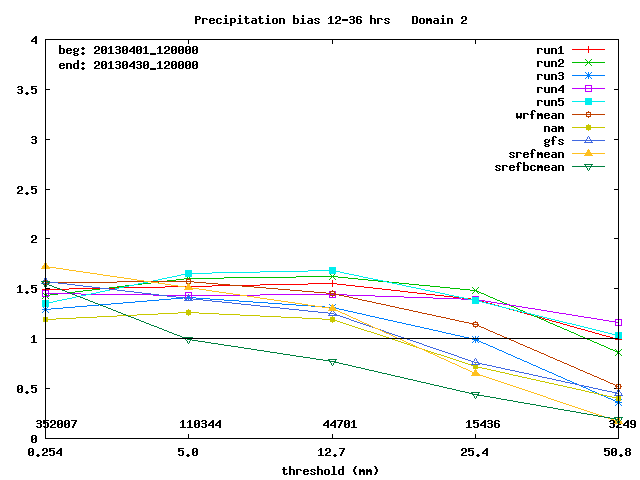
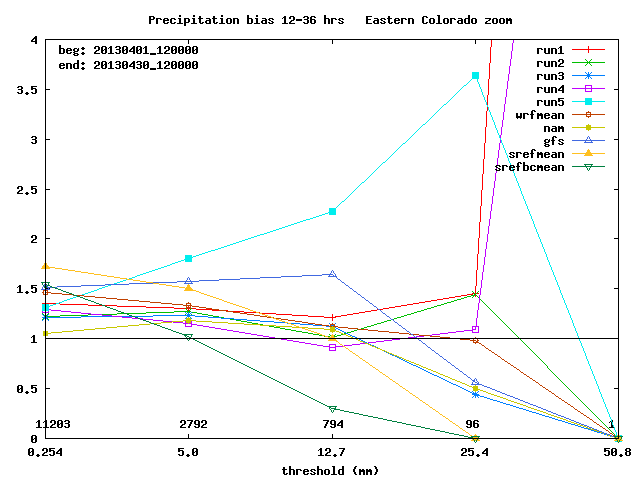
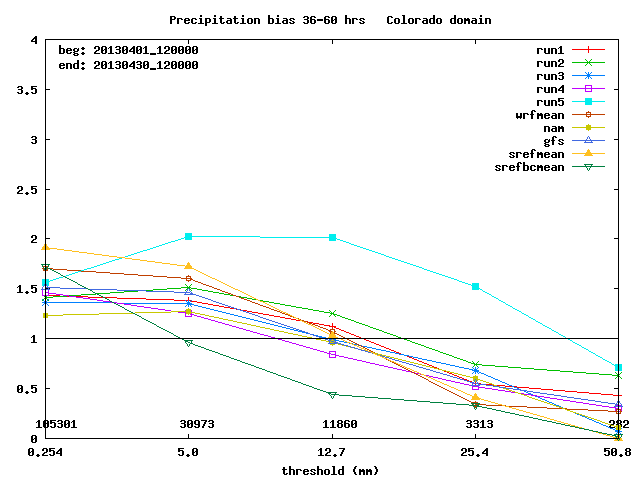
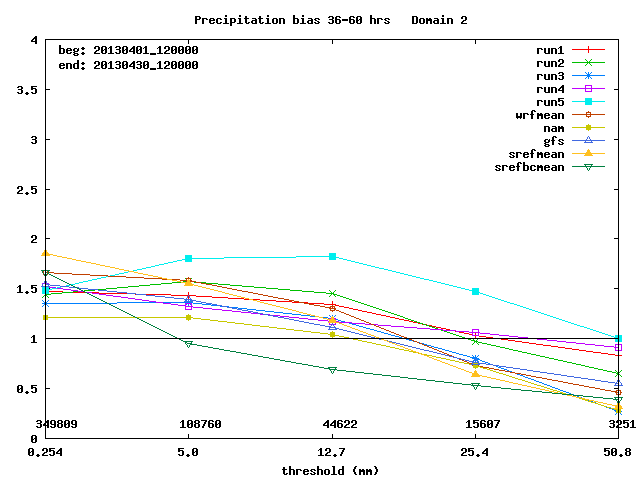
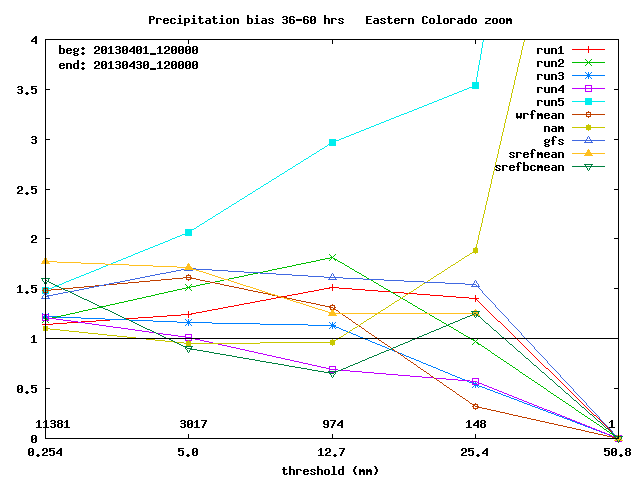
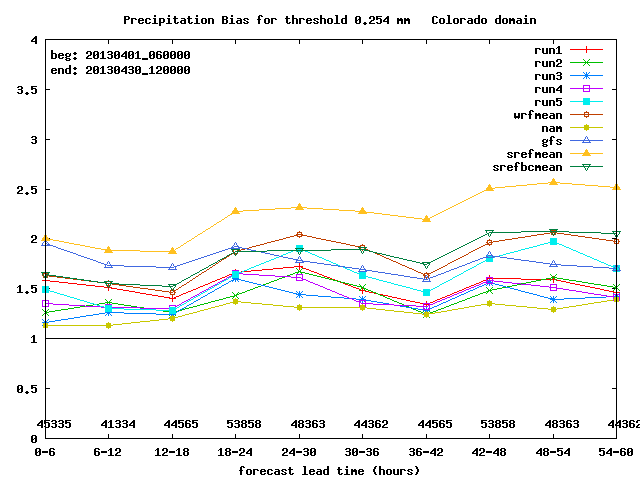
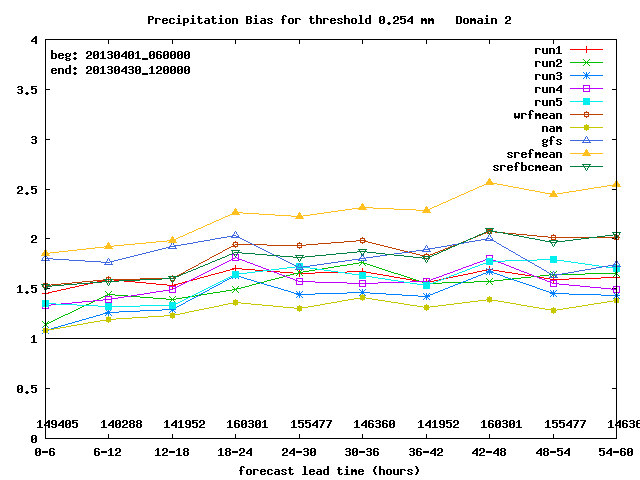
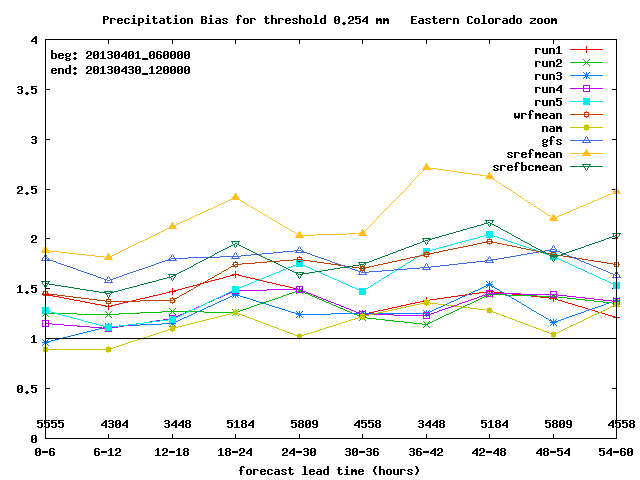
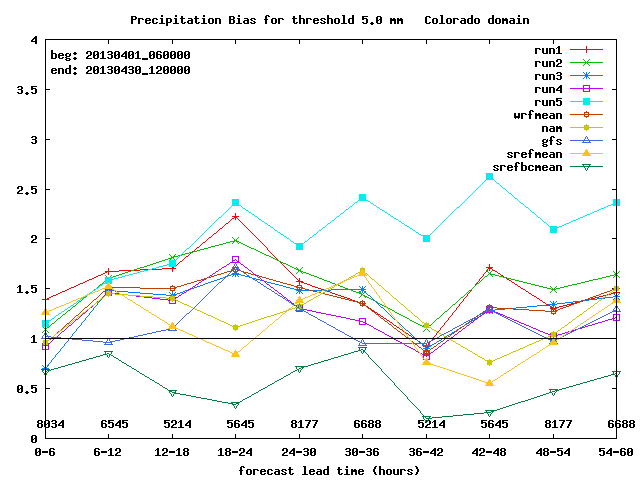
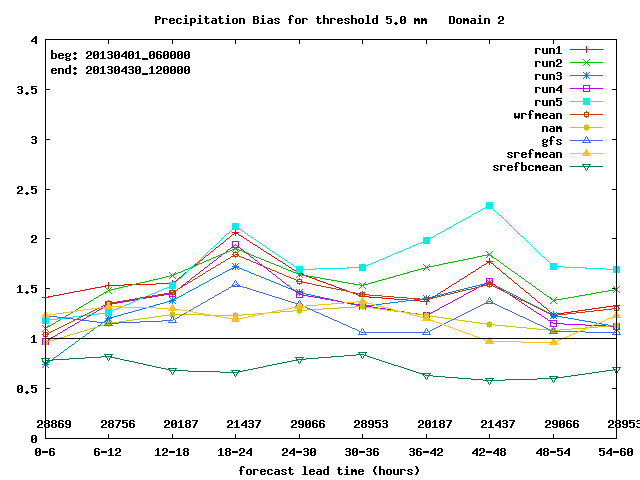
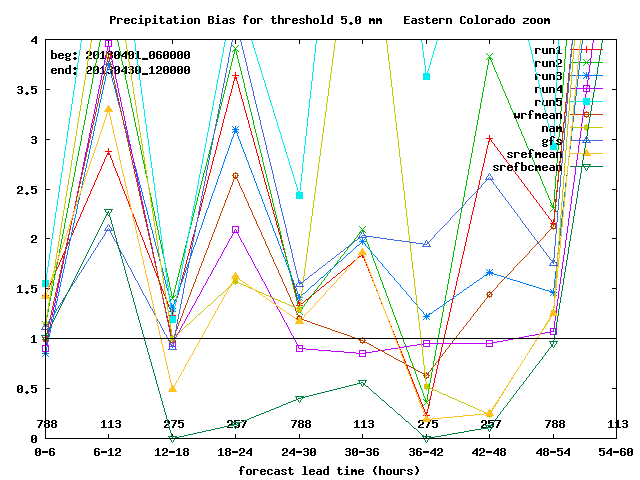
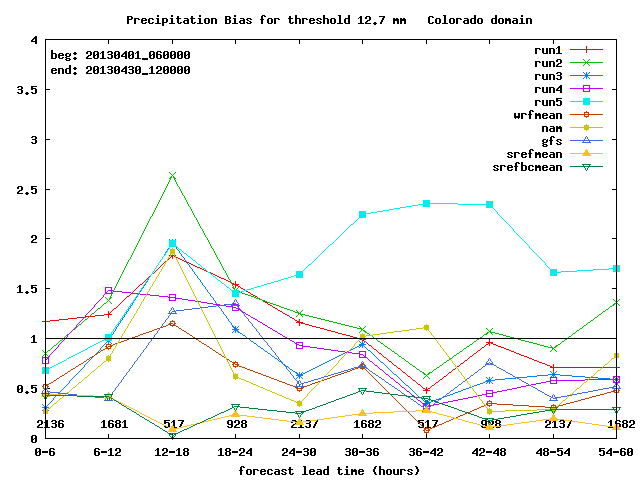
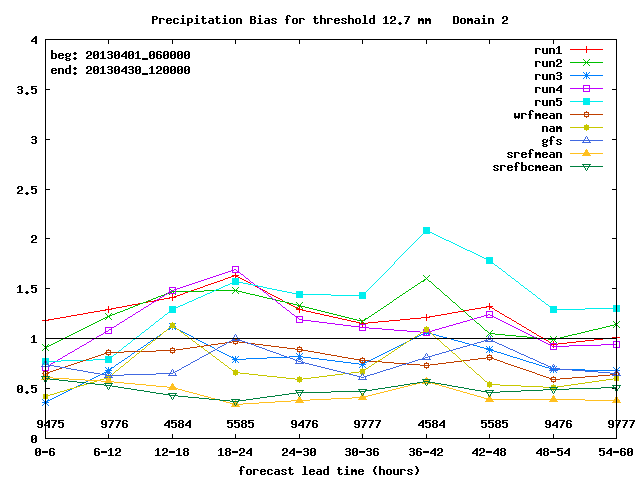
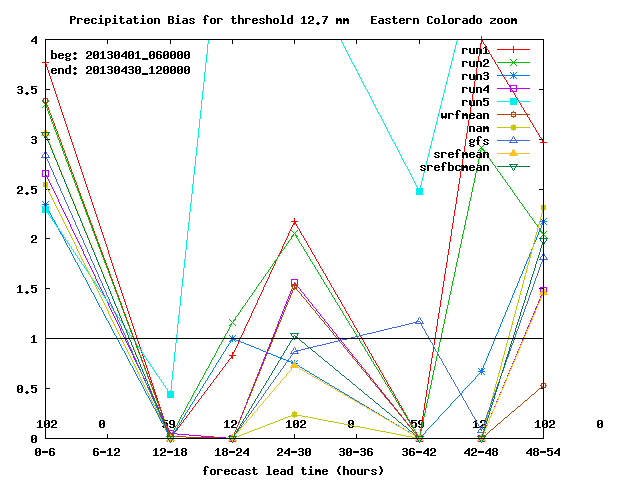
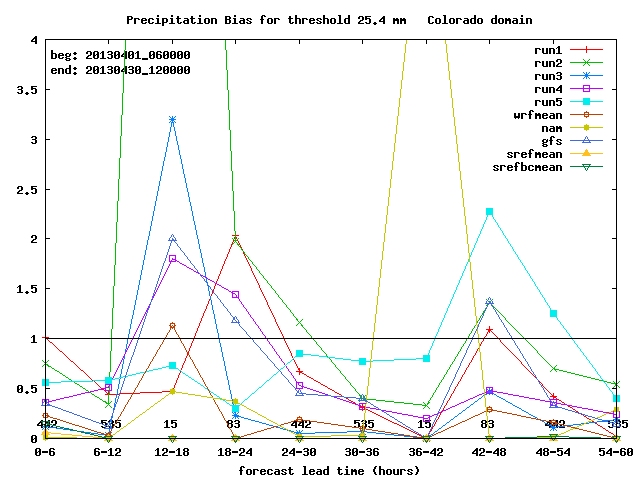
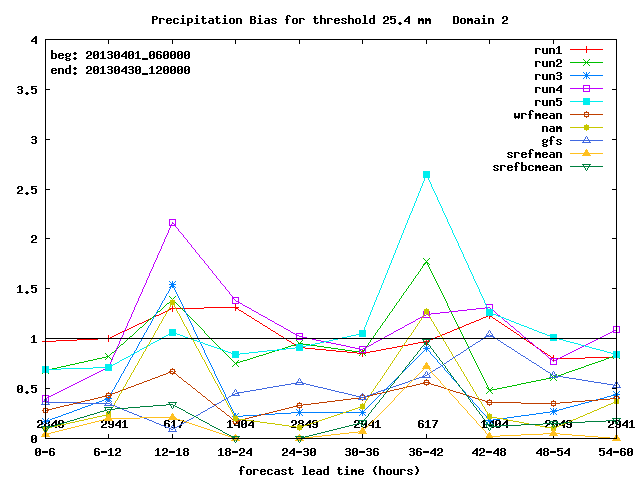
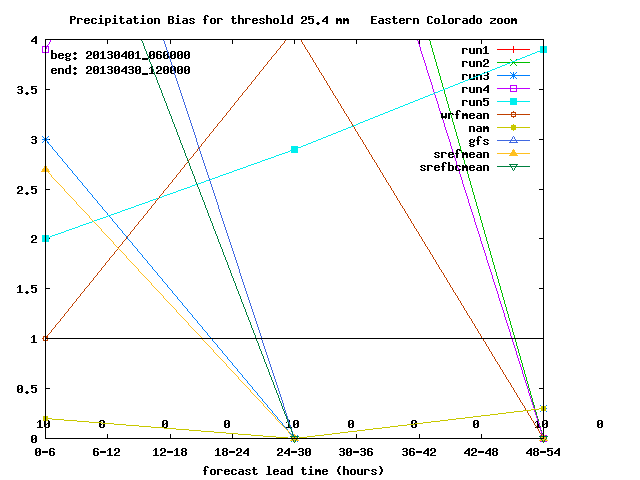
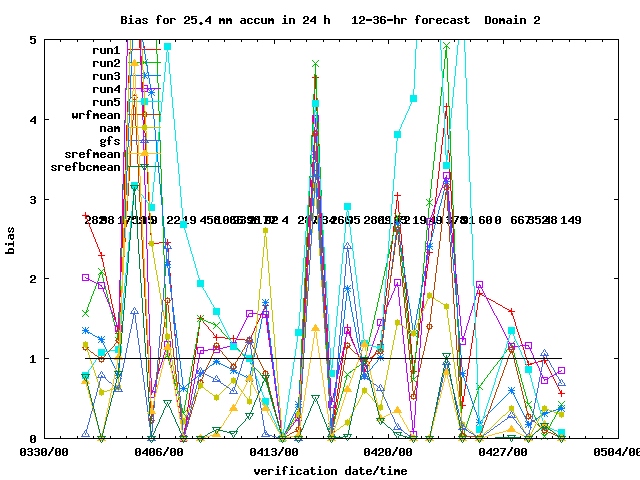
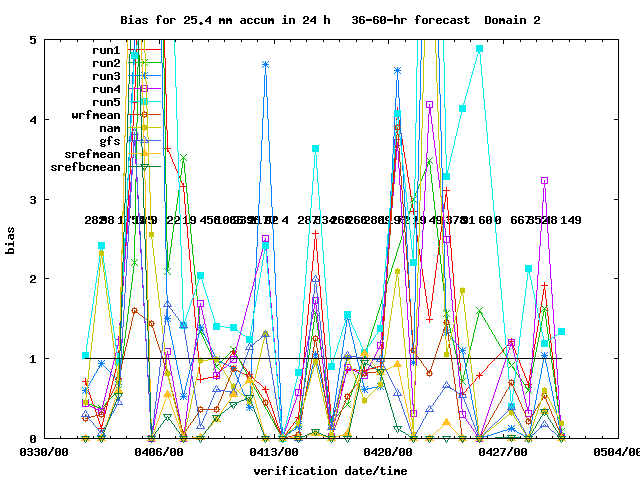
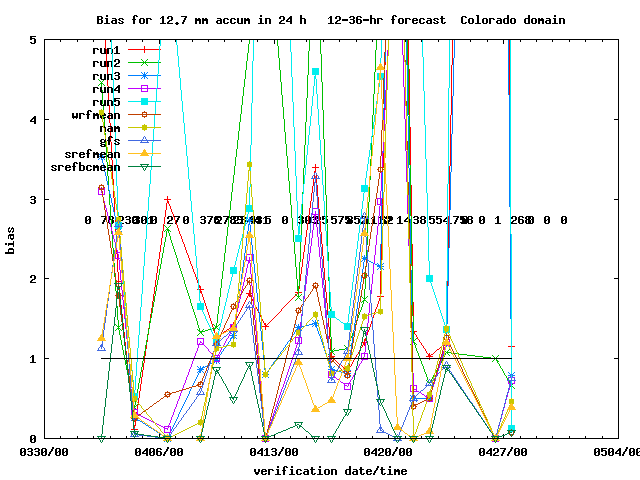
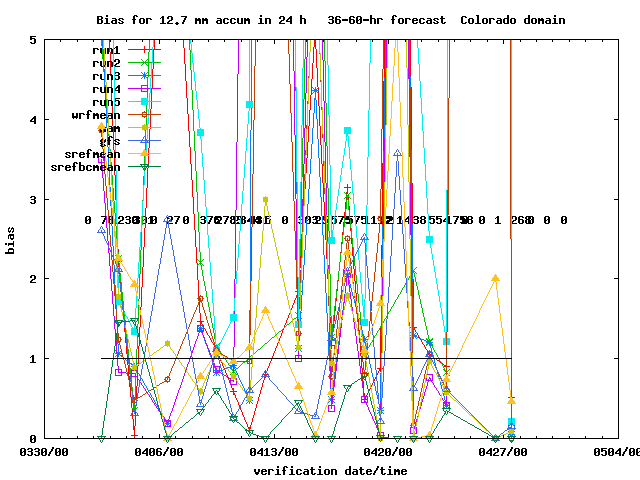
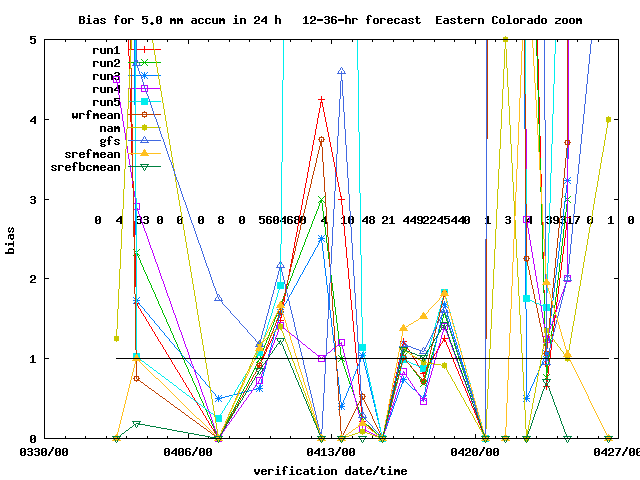
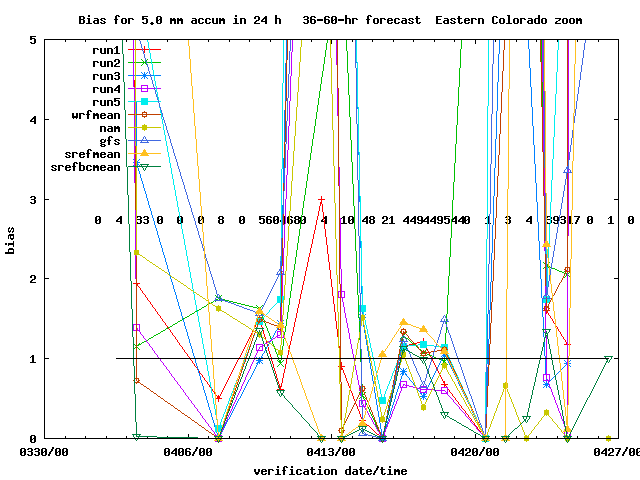
-- Bias = Frequency bias, the closer to 1 the better; values above 1 indicate the model predicts that amount of precip too frequently
-- Left two columns show statistics for a subdomain centered on Fort Collins, shown in these maps.
-- Right two columns show statistics for all of domain 2 (12-km grid spacing), which is the inner grid shown here. It covers much of the western and central US.
-- The "Eastern Colorado zoom" domain is a model subdomain covering only eastern Colorado and parts of eastern Wyoming and western Nebraska, shown here.
-- The top four rows show GSS and bias for 24-h precipitation forecasts versus accumulation threshold.
-- The next set of rows show GSS and bias for 6-h precip forecasts versus lead time at different accumulation thresholds.
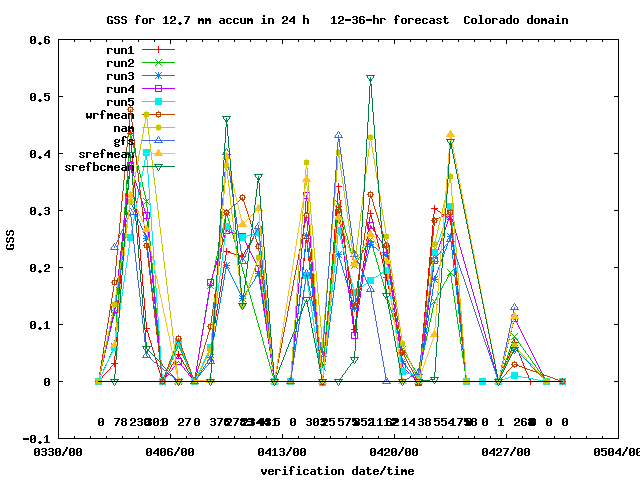
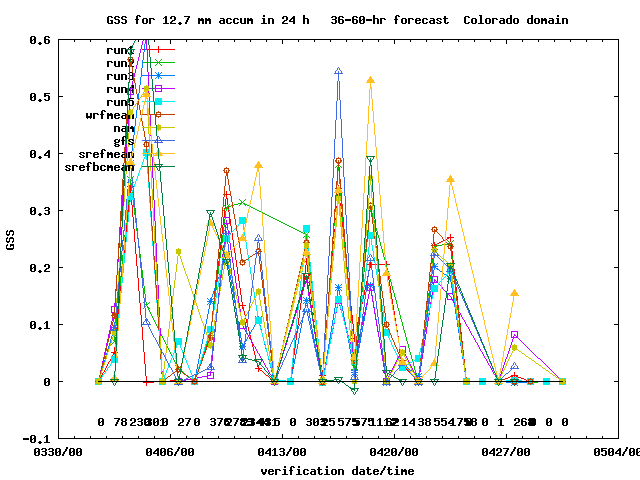
-- At the very bottom are time series of GSS and bias for the 24-h accumulation, showing how the forecasts performed from day to day.
-- Scores are calculated using the Meteorological Evaluation Tools software package.
12--36-hour precipitation forecast
36--60-hour precipitation forecast
Time series: 0.254 mm (0.01 inch) in 6 hr
Time series: 5.0 mm (0.2 inch) in 6 hr
Time series: 12.7 mm (0.5 inch) in 6 hr
Time series: 25.4 mm (1.0 inch) in 6 hr
Time series: GSS and bias vs. date for 25.4 mm in 24 hours (full domain 2)
Time series: GSS and bias vs. date for 12.7 mm in 24 hours (Colorado domain)
Time series: GSS and bias vs. date for 5.0 mm in 24 hours (eastern Colorado zoom)

