Colorado State University
Real-Time Weather Data
Precip. Sys. Research Group
Colorado State University
Real-Time Weather Data
Precip. Sys. Research Group
Colorado State University
Real-Time Weather Data
Precipitation Systems Research Group
Skip navigation
  • Home
  • Quick Looks
    • Fort Collins
  • CSU WRF Forecasts
    • 12-km Ensemble: CO
    • 12-km Ensemble: WxC Site
    • 12-km Forecast Soundings
    • 12-km Upper Level Charts
    • 4-km Forecast
    • 4-km Forecast: WxC Zoom
    • 4-km Forecast: RELAMPAGO
    • 4-km Forecast Soundings
    • 12-km Model Information
    • 4-km Model Information
  • Model Forecasts
    • GFS
    • NAM
    • GEFS
    • SREF
    • NAM 3-km Nest
    • HRRR
    • ECMWF
    • Extreme QPF Monitor
    • Extreme QPFs (MLearning)
    • Severe Weather (MLearning)
  • Heavy Precip
    • Original (Atlas 40)
    • New (Atlas 14)
    • QPF (Forecasts)
    • TORFF Identification
  • Links
    • Fort Collins Weather Station
    • Christman Field Wx Station
    • CoAgMET
    • NWS Denver/Boulder
    • NWS Cheyenne
    • CIRA SLIDER satellite imagery
    • Local Radar Loop
    • Fort Collins Rain Gauges

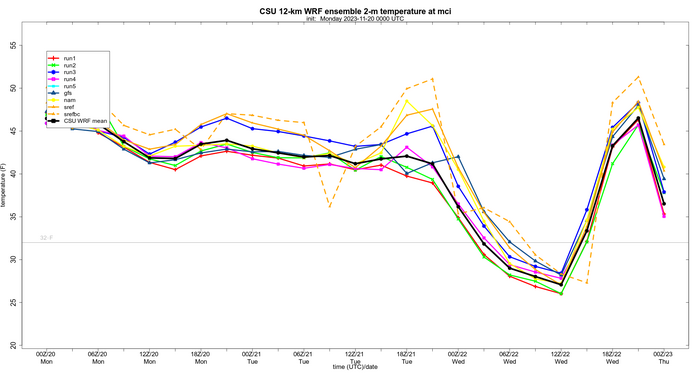
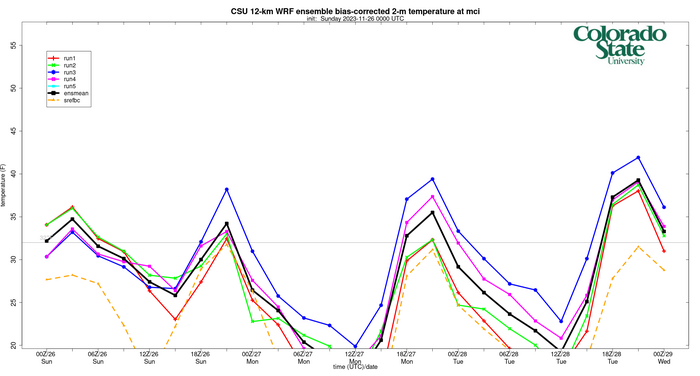
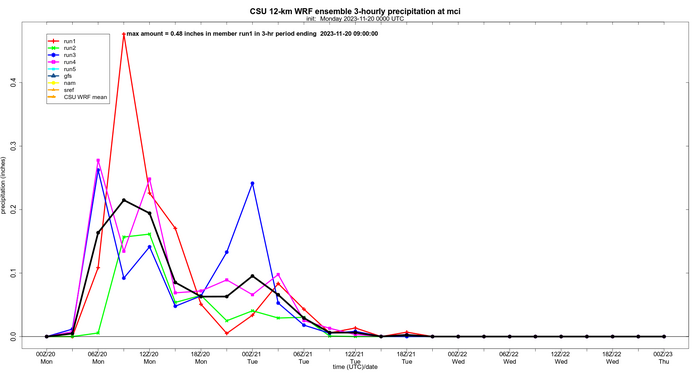
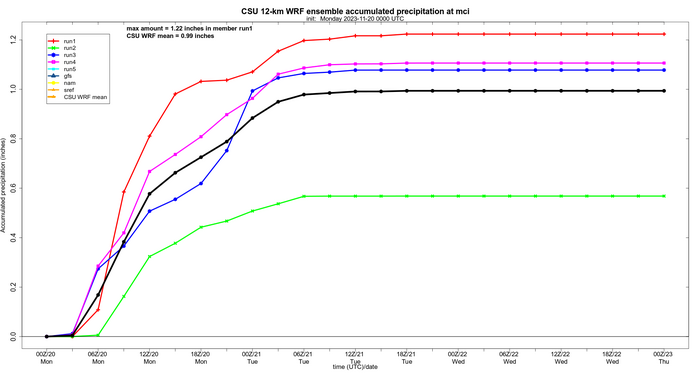
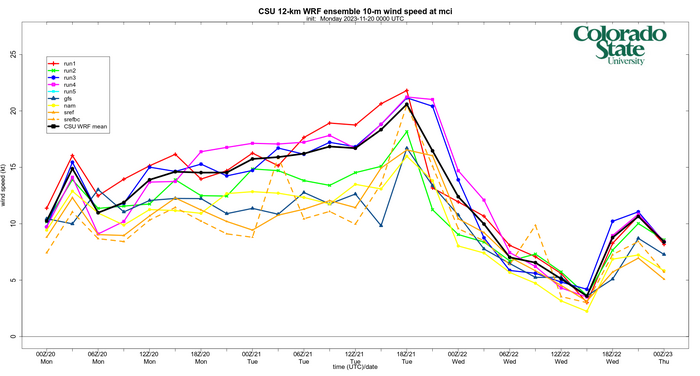
CSU WRF model forecasts: model comparison for WxChallenge site

Current city is: KMCI KANSAS CITY/INTL MO

The current run was initialized at 0000 UTC Wednesday January 25 2023.

precipitation for 24-h forecast period (06 UTC-06 UTC)
MSLP, 1000–500-hPa thickness, 3-hour precip (all of domain 2) (click image for animation)
MSLP, surface temperature, and winds (click image for animation)
10-meter wind speed (click image for animation)
Mean-layer CAPE and 0–6-km vector wind shear (click image for animation)
LCL height and 0–1-km vector wind shear (click image for animation)
925-mb temperature and isotachs (click for animation)
Surface temperature time series
Bias-corrected surface temperature time series (using average bias of each run from past 7 days)
3-hour precipitation time series
Accumulated precipitation time series
10-meter wind speed time series
Unidata badge

DISCLAIMER: The images and data on this site are intended for meteorological education and research purposes and, although they should generally be up to date, are not monitored at all times. Do not use for making decisions where money or lives are at stake. For official forecasts and warnings, visit the National Weather Service.

Walter Scott, Jr.
College of Engineering
Research Group Home People Research Teaching Resources Contact
Precip. Systems Research Group
GIVE
Contact CSU Equal Opportunity Privacy Statement Disclaimer

© 2023 Colorado State University, Fort Collins, Colorado 80523 USA

© 2023 Colorado State University,
Fort Collins, Colorado 80523 USA

Colorado State University logo